| << Chapter < Page | Chapter >> Page > |
The high level design of our project is as follows. We have a Behringer UCA222 that serves as the interface between the pickup in the guitar and the computer. The final output is played on the speaker that is connected to the UCA via a 3.5mm audio jack. The UCA222 takes the guitar input through dual channel RCA ports and forwards the signal to the computer through USB. We then do computation and analysis, in Python, on the sample signal to determine the frequency and the identity of the note being played, and depending on the note synthesis the correct harmony. The synthesized signal is fed back into the UCA222 and outputted on the speaker.

Figure 1: Block Diagram of our System

Figure 2: Picture of our Setup
We sampled the analog signal of the pickup through the UCA222. The UCA222 is programmed to anti-alias and sample and forward the data into system audio. We can then access system audio via a Python library called PyAudio. PyAudio is able to give us vectors of the samples of a desired length. Compared the difference in latency to our system between different vector length and decide that 1024 was a good middle ground. We decided to further lowpass filter the sampled chunks to reduce high frequency noise introduced by the ‘fret-buzz’ and the initial attack of the guitar string.
import numpy
import pyaudioimport scipy
import math# constants
fs = 44100.0CHUNK = 1024
cutoff_hz = 8000.0nyq_rate = fs / 2. # for normalizing
width = 1000.0/nyq_rateripple_db = 30.0

# open pyaudio streamp = pyaudio.PyAudio()
stream = p.open(format=pyaudio.paFloat32,channels=1, rate=44100,
                    input=True,output=True,
                    frames_per_buffer=CHUNK)# build filter
N, beta = scipy.signal.kaiserord(ripple_db, width)taps = scipy.signal.firwin(N, cutoff_hz/nyq_rate, window=('kaiser', beta))
delay = 0.5 * (N-1) / fswhile(True):
    data = stream.read(CHUNK)x = numpy.fromstring(data, dtype=numpy.float32)
    x_filtered = scipy.signal.lfilter(taps, 1.0, x)X = numpy.fft.fft(x_filtered)

stream.close()p.terminate()
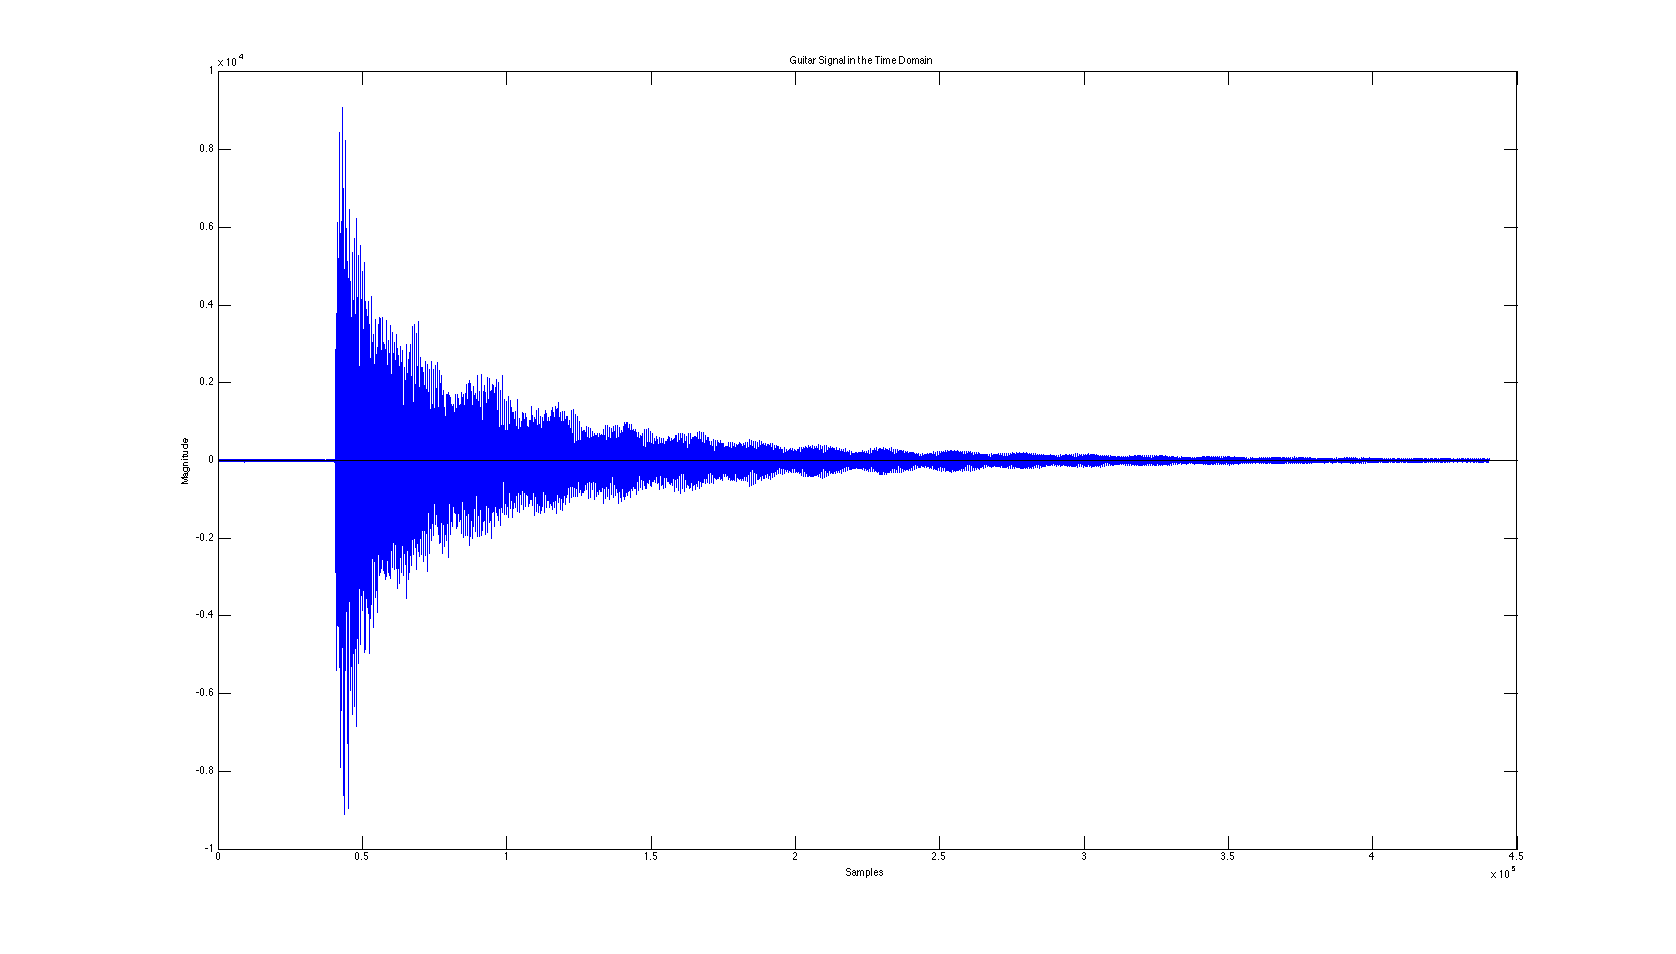
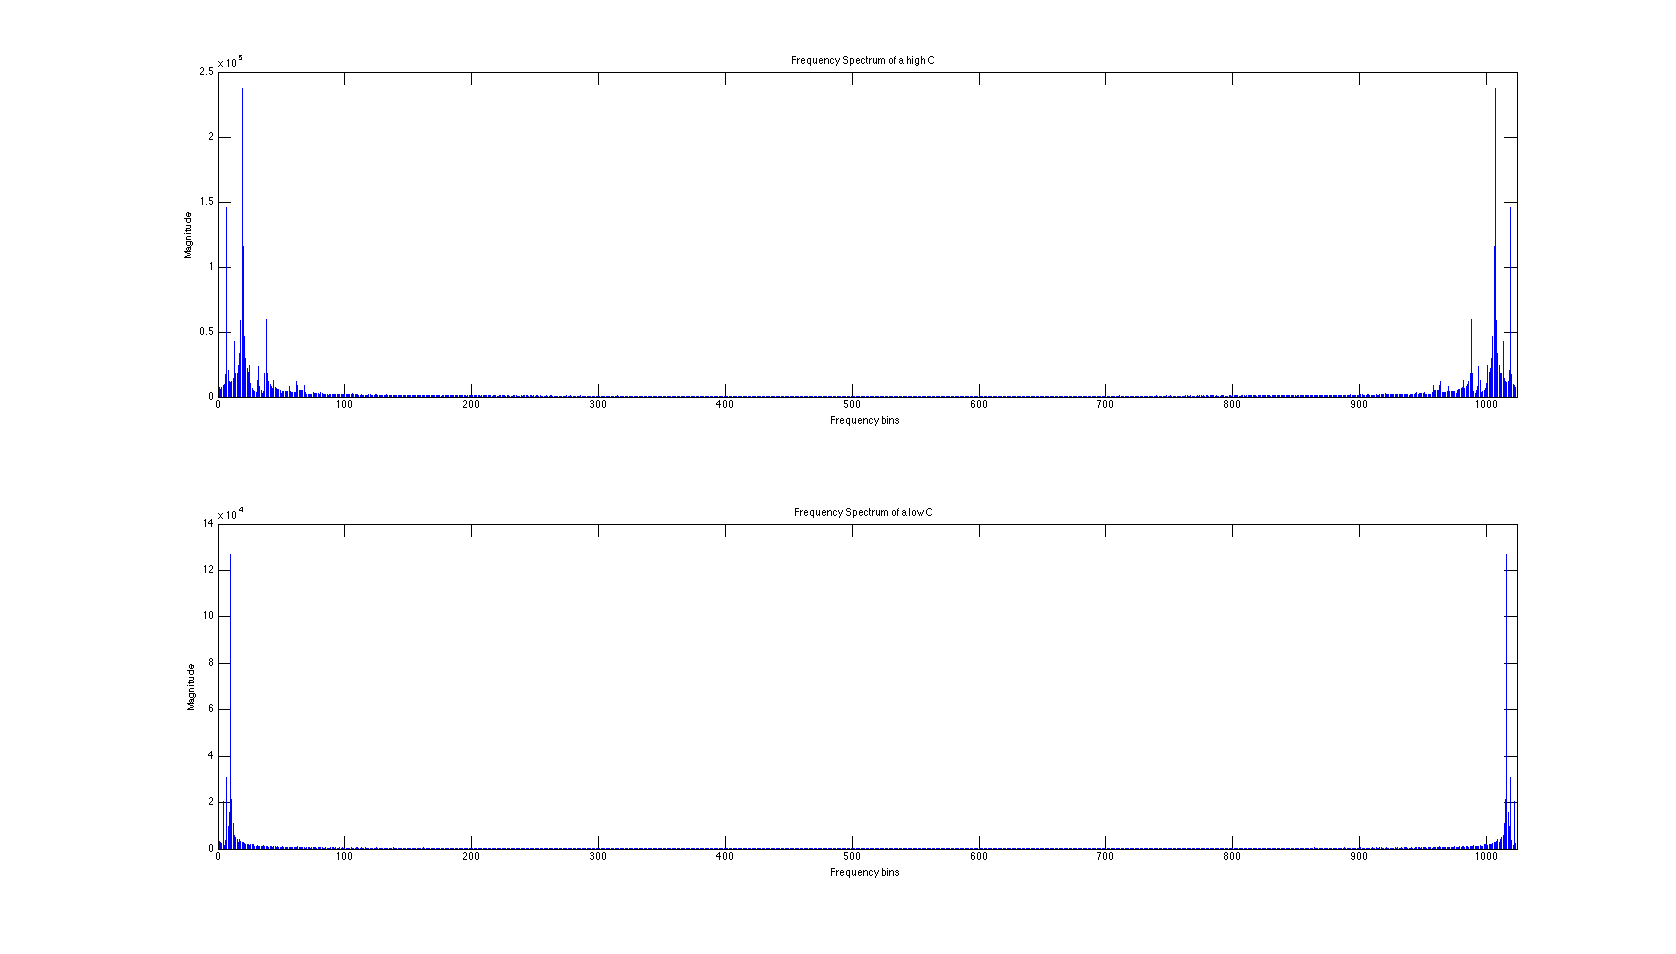
From this, we are able to analysis each frame of 1024 samples and compute the frequency content of the frames. We played a few different notes and plotted the frequency content of notes in hopes of figuring out a good way to differentiate between notes. Below are plots of a note being struck in the time domain, and frequency spectrum plots of a high and low C note.

Figure 3: Time Domain Plot of a note being played

Figure 4: Frequency Spectrum of a High and Low C
After looking at the frequency domain, it is obvious that each note has one distinct peak at a particular frequency. So we decided to do note detection by finding the frequency with the largest magnitude. In other words, we are doing max-peak detection. In doing this, we took the absolute value of the frequency bins in the positive half of the spectrum and use the argmax function from the NumPy library obtain the frequency bin with the highest peak. However, in using this method we very quickly encountered a problem. When a certain note is played on the guitar, though the profile of the note in the frequency domain will not change very much, the maximum peak in fact moves around a little. Because other approach only looks at the highest peak, sometimes we will get errors when the neighboring peaks overtake the correct main peak in magnitude. When this happens our program will think the note is quickly changing, but actually it is just the same note reverberating through the guitar.

Notification Switch
Would you like to follow the 'Elec 301 projects fall 2015' conversation and receive update notifications?