| << Chapter < Page | Chapter >> Page > |
By the end of this section, you will be able to:
Just as utility and marginal utility can be used to discuss making consumer choices along a budget constraint, these ideas can also be used to think about how consumer choices change when the budget constraint shifts in response to changes in income or price. Indeed, because the budget constraint framework can be used to analyze how quantities demanded change because of price movements, the budget constraint model can illustrate the underlying logic behind demand curves.
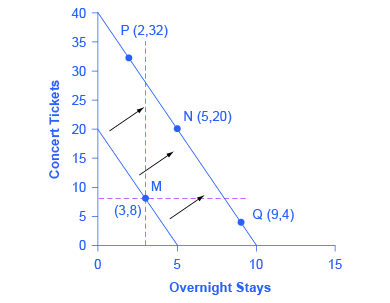
Let’s begin with a concrete example illustrating how changes in income level affect consumer choices. [link] shows a budget constraint that represents Kimberly’s choice between concert tickets at $50 each and getting away overnight to a bed-and-breakfast for $200 per night. Kimberly has $1,000 per year to spend between these two choices. After thinking about her total utility and marginal utility and applying the decision rule that the ratio of the marginal utilities to the prices should be equal between the two products, Kimberly chooses point M, with eight concerts and three overnight getaways as her utility-maximizing choice.

Now, assume that the income Kimberly has to spend on these two items rises to $2,000 per year, causing her budget constraint to shift out to the right. How does this rise in income alter her utility-maximizing choice? Kimberly will again consider the utility and marginal utility that she receives from concert tickets and overnight getaways and seek her utility-maximizing choice on the new budget line. But how will her new choice relate to her original choice?
The possible choices along the new budget constraint can be divided into three groups, which are divided up by the dashed horizontal and vertical lines that pass through the original choice M in the figure. All choices on the upper left of the new budget constraint that are to the left of the vertical dashed line, like choice P with two overnight stays and 32 concert tickets, involve less of the good on the horizontal axis but much more of the good on the vertical axis. All choices to the right of the vertical dashed line and above the horizontal dashed line—like choice N with five overnight getaways and 20 concert tickets—have more consumption of both goods. Finally, all choices that are to the right of the vertical dashed line but below the horizontal dashed line, like choice Q with four concerts and nine overnight getaways, involve less of the good on the vertical axis but much more of the good on the horizontal axis.

Notification Switch
Would you like to follow the 'Openstax microeconomics in ten weeks' conversation and receive update notifications?