<< Chapter < Page Chapter >> Page >
  • Explain the differences and similarities between AC and DC current.
  • Understand rms voltage, current, and average power.
  • Explain why AC current is used for power transmission.

Alternating current

Most of the examples dealt with so far, and particularly those utilizing batteries, have constant voltage sources. Once the current is established, it is thus also a constant. Direct current (DC) is the flow of electric charge in only one direction. It is the steady state of a constant-voltage circuit. Most well-known applications, however, use a time-varying voltage source. Alternating current (AC) is the flow of electric charge that periodically reverses direction. If the source varies periodically, particularly sinusoidally, the circuit is known as an alternating current circuit. Examples include the commercial and residential power that serves so many of our needs. [link] shows graphs of voltage and current versus time for typical DC and AC power. The AC voltages and frequencies commonly used in homes and businesses vary around the world.
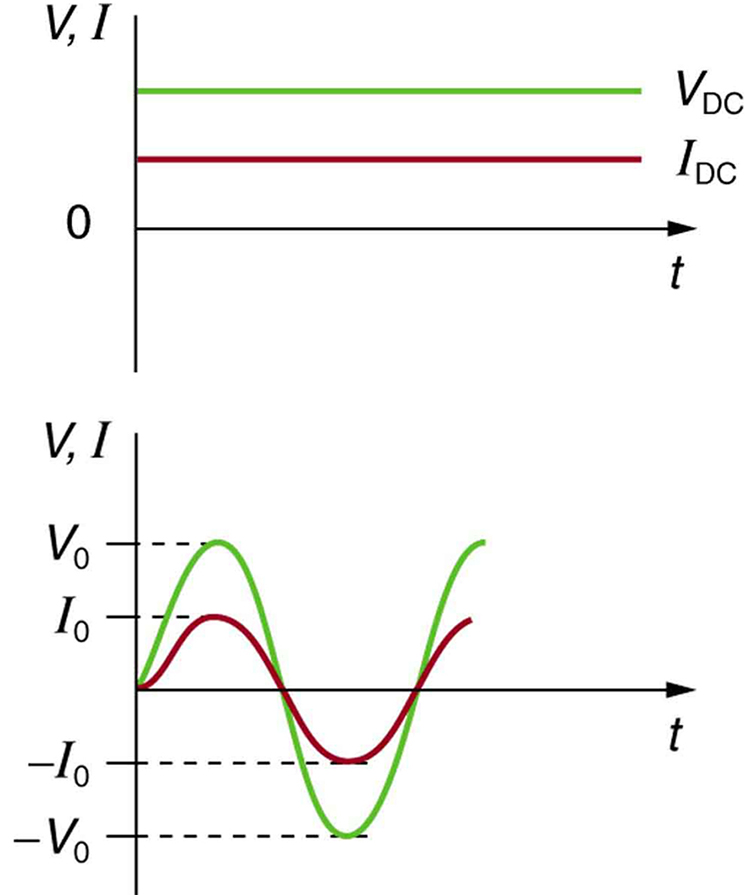
Part a shows a graph of voltage V and current I versus time for a D C source. The time is along the x axis and V and I are along the y axis. The graph shows that the voltage V sub D C and the current I sub D C do not vary with time. Part b shows the variation of voltage V and current I with time for an A C source. The time is along the horizontal axis and V and I are along the vertical axis. The graph for I is a progressing sine wave with a peak value I sub zero on the positive y axis and negative I sub zero on the negative y axis. The graph for V is a progressing sine wave with a higher amplitude than the current curve with a peak value V sub zero on the positive y axis and negative V sub zero on the negative y axis. The peak values of the voltage and current sine waves occur at the same time because they are in phase.
(a) DC voltage and current are constant in time, once the current is established. (b) A graph of voltage and current versus time for 60-Hz AC power. The voltage and current are sinusoidal and are in phase for a simple resistance circuit. The frequencies and peak voltages of AC sources differ greatly.
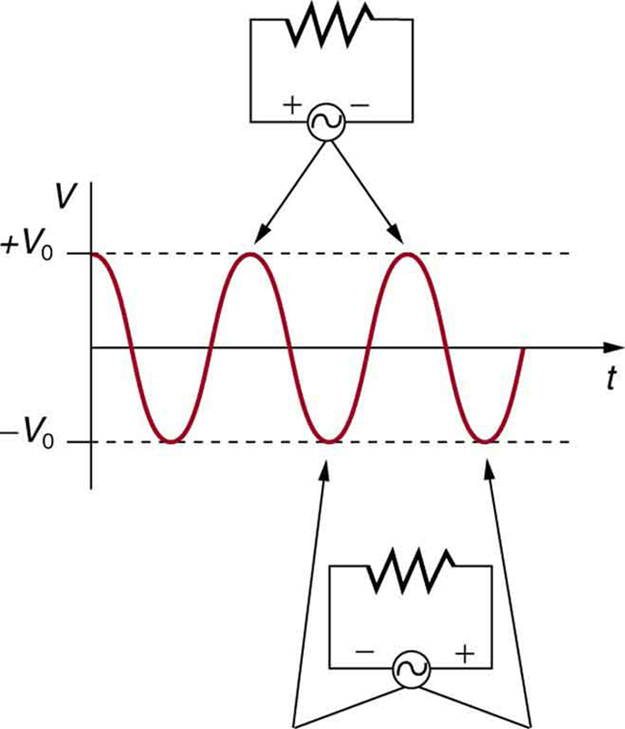
The potential difference variation of an alternating current voltage source with time is shown as a progressing sine wave. The voltage is shown along the vertical axis and the time is along the horizontal axis. Circuit diagrams show that current flowing in one direction corresponds to positive values of the voltage sine wave. Current flowing in the opposite direction in the circuit corresponds to negative values of the voltage sine wave. The maximum value of the voltage sine wave is plus V sub zero. The minimum value of the voltage sine wave is minus V sub zero.
The potential difference V between the terminals of an AC voltage source fluctuates as shown.

[link] shows a schematic of a simple circuit with an AC voltage source. The voltage between the terminals fluctuates as shown. For this example, the voltage and current are said to be in phase, as seen in [link] (b).

Current in the resistor alternates back and forth just like the driving voltage, since I = V/R size 12{I = ital "V/R"} {} . If the resistor is a fluorescent light bulb, for example, it brightens and dims 120 times per second as the current repeatedly goes through zero. A 120-Hz flicker is too rapid for your eyes to detect, but if you wave your hand back and forth between your face and a fluorescent light, you will see a stroboscopic effect evidencing AC. The fact that the light output fluctuates means that the power is fluctuating. The power supplied is P = IV size 12{P = ital "IV"} {} .

Making connections: take-home experiment—ac/dc lights

Wave your hand back and forth between your face and a fluorescent light bulb. Do you observe the same thing with the headlights on your car? Explain what you observe. Warning: Do not look directly at very bright light .
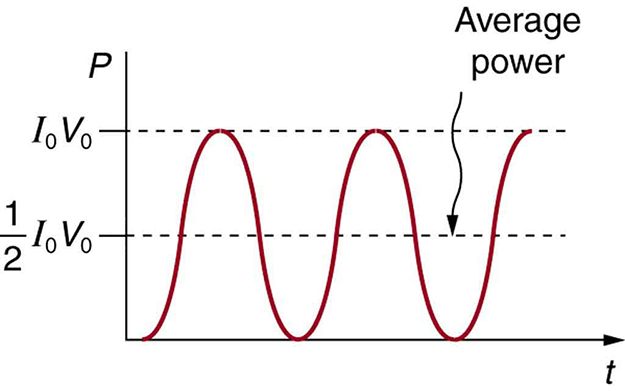
A graph showing the variation of power P with time t. The power is along the vertical axis and time is along the horizontal axis. The curve is a sine wave starting at the origin on the horizontal axis and having the crests and troughs both above the positive horizontal axis. The maximum value of power is given by the peak value, which is the product of I sub zero and V sub zero. The average power is indicated by a dotted line through the center of the wave parallel to the horizontal axis with a value half of the product of I sub zero and V sub zero.
AC power as a function of time.

We are most often concerned with average power rather than its fluctuations—that 60-W light bulb in your desk lamp has an average power consumption of 60 W, for example. As illustrated in [link] .

It is standard practice to quote I rms size 12{I rSub { size 8{"rms"} } } {} , V rms size 12{V rSub { size 8{"rms"} } } {} , and P ave size 12{P rSub { size 8{"ave"} } } {} rather than the peak values. For example, most household electricity is 120 V AC, which means that V rms size 12{V rSub { size 8{"rms"} } } {} is 120 V. The common 10-A circuit breaker will interrupt a sustained I rms size 12{I rSub { size 8{"rms"} } } {} greater than 10 A. Your 1.0-kW microwave oven consumes P ave = 1.0 kW size 12{P rSub { size 8{"ave"} } =1 "." 0`"kW"} {} , and so on. You can think of these rms and average values as the equivalent DC values for a simple resistive circuit.

Practice Key Terms 4

Get Jobilize Job Search Mobile App in your pocket Now!

Get it on Google Play Download on the App Store Now


Source:  OpenStax, Concepts of physics. OpenStax CNX. Aug 25, 2015 Download for free at https://legacy.cnx.org/content/col11738/1.5
Google Play and the Google Play logo are trademarks of Google Inc.

Notification Switch

Would you like to follow the 'Concepts of physics' conversation and receive update notifications?

Ask