| << Chapter < Page | Chapter >> Page > |
As previously discussed, normal distributions do not necessarily have the same means and standarddeviations. A normal distribution with a mean of 0 and a standard deviation of 1 is called a standard normal distribution and is typically represented by .
Areas underneath the normal distribution are often represented by tables of the standard normal distribution. A portion of a table of thestandard normal distribution is shown in [link] .
| Z | Area left of Z |
|---|---|
| -2.50 | 0.0062 |
| -2.49 | 0.0064 |
| -2.48 | 0.0066 |
| -2.47 | 0.0068 |
| -2.46 | 0.0069 |
| -2.45 | 0.0071 |
| -2.44 | 0.0073 |
| -2.43 | 0.0075 |
| -2.42 | 0.0078 |
| -2.41 | 0.0080 |
| -2.40 | 0.0082 |
| -2.39 | 0.0084 |
| -2.38 | 0.0087 |
| -2.37 | 0.0089 |
| -2.36 | 0.0091 |
| -2.35 | 0.0094 |
| -2.34 | 0.0096 |
| -2.33 | 0.0099 |
| -2.32 | 0.0102 |
The first column titled contains values of the standard normal random variable; the second column contains the area below the curve to the left of . Since the distribution has a mean of 0 and a standard deviation of 1, the column is equal to the number of standard deviations below (or above) themean. For example, a of -2.5 represents a value 2.5 standard deviations below the mean. Thearea below the curve to the left of is 0.0062.
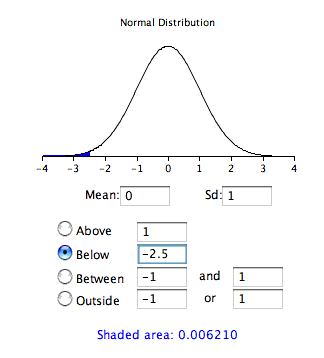
The same information can be obtained using a calculator or the following Java applet. [link] shows how it can be used to compute the area below the standard normal curve to the left of -2.5. Note that the mean is set to 0 andthe standard deviation is set to 1.

A value from any normal distribution can be transformed into its corresponding value on a standard normal distribution using thefollowing formula: where is the value on the standard normal distribution, is the value on the original distribution, is the mean of the original distribution and is the standard deviation of the original distribution.
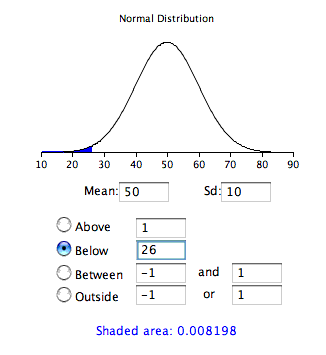
As a simple application, what portion of a normal distribution with a mean of 50 and a standard deviation of 10 is below26? Applying the formula we obtain
From
[link] , we can see
that 0.0082 of the distribution is below -2.4. There is no needto transform to
if you are using a technology or the
applet shown in
[link] .


Notification Switch
Would you like to follow the 'Collaborative statistics (custom lecture version modified by t. short)' conversation and receive update notifications?