| << Chapter < Page | Chapter >> Page > |
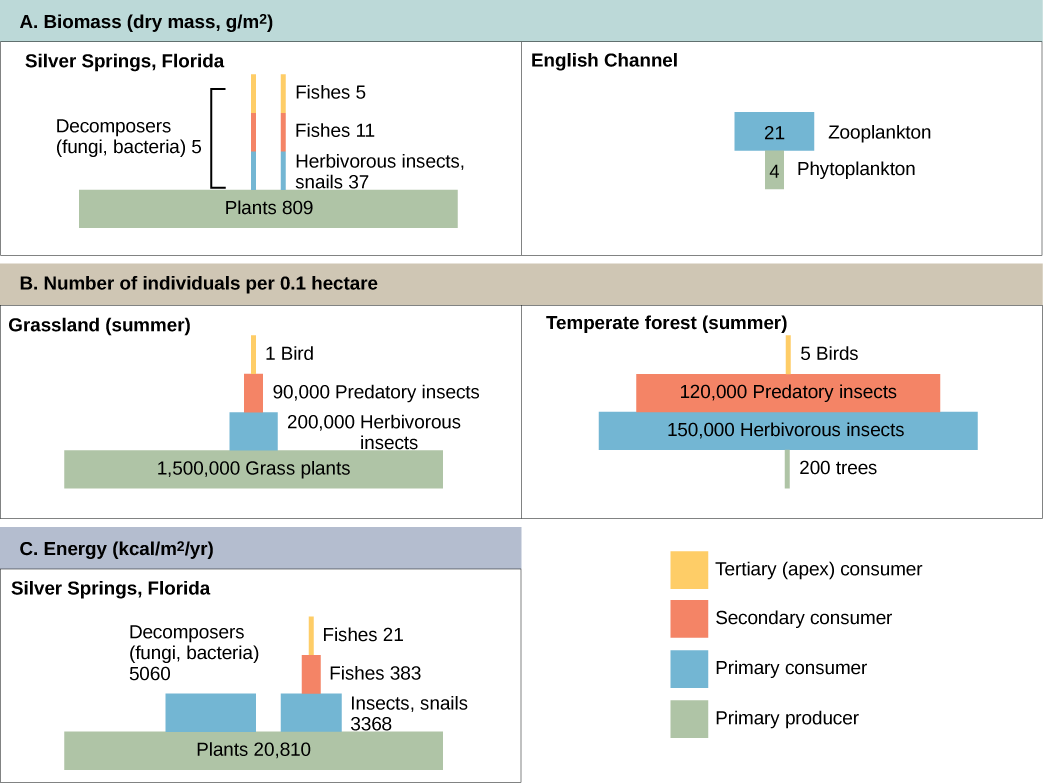
Pyramid ecosystem modeling can also be used to show energy flow through the trophic levels. Notice that these numbers are the same as those used in the energy flow compartment diagram in ( [link] ). Pyramids of energy are always upright, and an ecosystem without sufficient primary productivity cannot be supported. All types of ecological pyramids are useful for characterizing ecosystem structure. However, in the study of energy flow through the ecosystem, pyramids of energy are the most consistent and representative models of ecosystem structure ( [link] ).

One of the most important environmental consequences of ecosystem dynamics is biological magnification. Biological magnification is the increasing concentration of persistent, toxic substances in organisms at higher trophic levels, from the primary producers to the apex consumers. Many substances have been shown to bioaccumulate, including the pesticide d ichloro d iphenyl t richloroethane (DDT), which was first publicized in the 1960s bestseller, Silent Spring , by Rachel Carson. DDT was a commonly used pesticide before it became known that DDT and its metabolites persist in ecosystems and organisms, and these compounds can have harmful effects on many species in the higher trophic levels. In some aquatic ecosystems, organisms in higher trophic levels consume many individuals from the trophic level below. Small amounts of toxins in the water become increasingly concentrated (magnified) from lower trophic levels to higher trophic levels. So, DDT occurs in low concentrations in the water is acquired by the producers, then magnified in the primary consumers (small aquatic animals), then magnified again in the secondary consumers (fish), and again in higher consumers such as fish-eating birds (Ospreys, Pelicans, Bald Eagles). High levels of DDT metabolites cause the eggshells of birds to become thin and fragile; they often crack or break long before the baby bird hatches out. This effect resulted in significant declines in populations of fish-eating birds. The use of DDT was banned in the United States in the 1970s.
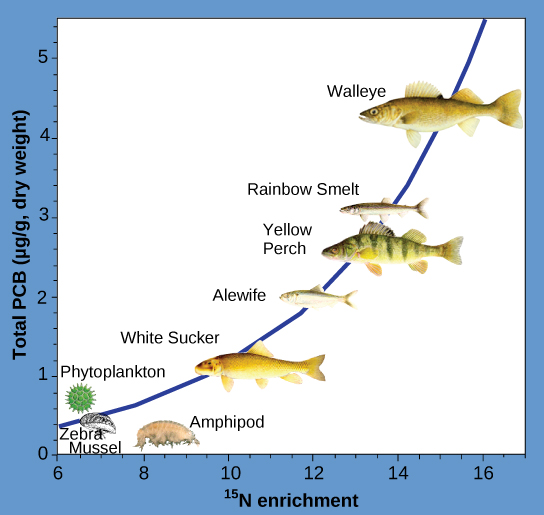
Other substances that biomagnify are polychlorinated biphenyls (PCBs), which were used in coolant liquids in the United States until their use was banned in 1979, and heavy metals, such as mercury, lead, and cadmium. These substances were best studied in aquatic ecosystems, where fish species at different trophic levels accumulate toxic substances that are found in low concentrations in the primary producers. As illustrated in a study performed by the National Oceanic and Atmospheric Administration (NOAA) in the Saginaw Bay of Lake Huron ( [link] ), PCB concentrations increased from the ecosystem’s primary producers (phytoplankton) through the different trophic levels of fish species. The apex consumer (walleye) has more than four times the amount of PCBs per gram, compared to phytoplankton. Additionally, based on results from other studies, birds that eat these fish may have PCB levels at least one order of magnitude higher than those found in the lake fish.

Other concerns have been raised by the accumulation of heavy metals, such as mercury and cadmium, in certain types of seafood. The United States Environmental Protection Agency (EPA) recommends that pregnant women and young children should not consume any top predator species such as swordfish, shark, king mackerel, or tilefish, because of their high mercury content. These individuals are advised to eat fish low in mercury: salmon, tilapia, shrimp, pollock, and catfish, which are lower on the trophic pyramids in their ecosystems. Biological magnification is a good example of how ecosystem dynamics can affect our everyday lives, even influencing the food we eat.

Notification Switch
Would you like to follow the 'Principles of biology' conversation and receive update notifications?