| << Chapter < Page | Chapter >> Page > |
This tells us that for all values of , is always greater than . Therefore if , the range of is .
Similarly, it can be shown that if that the range of is . This is left as an exercise.
For example, the domain of is because there is no value of for which is undefined. The range of can be calculated as follows:
Therefore the range is .
For functions of the form, , the details of calculating the intercepts with the and axis is given.
The -intercept is calculated as follows:
For example, the -intercept of is given by setting to get:
The -intercepts are calculated as follows:
However, [link] is only valid if which means that either or . This is consistent with what we expect, since if and then is negative and in this case the graph lies above the -axis and therefore does not intersect the -axis. If however, and , then is positive and the graph is hat shaped and should have two -intercepts. Similarly, if and then is also positive, and the graph should intersect with the -axis.
If then we have one intercept at .
For example, the -intercepts of is given by setting to get:
which is not real. Therefore, the graph of does not have any -intercepts.
The turning point of the function of the form is given by examining the range of the function. We know that if then the range of is and if then the range of is .
So, if , then the lowest value that can take on is . Solving for the value of at which gives:
at . The co-ordinates of the (minimal) turning point is therefore .
Similarly, if , then the highest value that can take on is and the co-ordinates of the (maximal) turning point is .
There is one axis of symmetry for the function of the form that passes through the turning point. Since the turning point lies on the -axis, the axis of symmetry is the -axis.
In order to sketch graphs of the form, , we need to determine five characteristics:
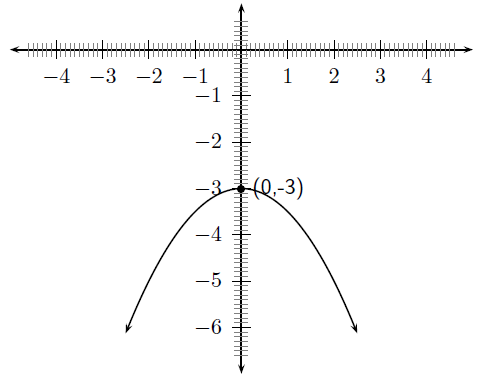
For example, sketch the graph of . Mark the intercepts, turning point and axis of symmetry.
Firstly, we determine that . This means that the graph will have a maximal turning point.
The domain of the graph is because is defined for all . The range of the graph is determined as follows:
Therefore the range of the graph is .
Using the fact that the maximum value that achieves is -3, then the -coordinate of the turning point is -3. The -coordinate is determined as follows:
The coordinates of the turning point are: .
The -intercept is obtained by setting . This gives:
The -intercept is obtained by setting . This gives:
which is not real. Therefore, there are no -intercepts which means that the function does not cross or even touch the -axis at any point.
We also know that the axis of symmetry is the -axis.
Finally, we draw the graph. Note that in the diagram only the y-intercept is marked. The graph has a maximal turning point (i.e. makes a frown) as determined from the sign of a, there are no x-intercepts and the turning point is that same as the y-intercept. The domain is all real numbers and the range is .

Draw the graph of .

The following video shows one method of graphing parabolas. Note that in this video the term vertex is used in place of turning point. The vertex and the turning point are the same thing.
Khan academy video on graphing parabolas - 1


Notification Switch
Would you like to follow the 'Maths grade 10 rought draft' conversation and receive update notifications?