| << Chapter < Page | Chapter >> Page > |
The example covered in this section provides an implementation of CTFT and its properties. As mentioned earlier, programming environments can generate and work with only discrete values arranged in arrays. Thus, to get a continuous-time representation of a signal, use a very small value of time increment dt. For example, dt=0.001 means there are 1000 discrete samples in 1 second, which provides a good approximation to represent a low-frequency signal. However, when working with very high-frequency signals, one should decrease the value of dt further to ensure there are enough samples to represent the signal in a continuous fashion over a specified duration.
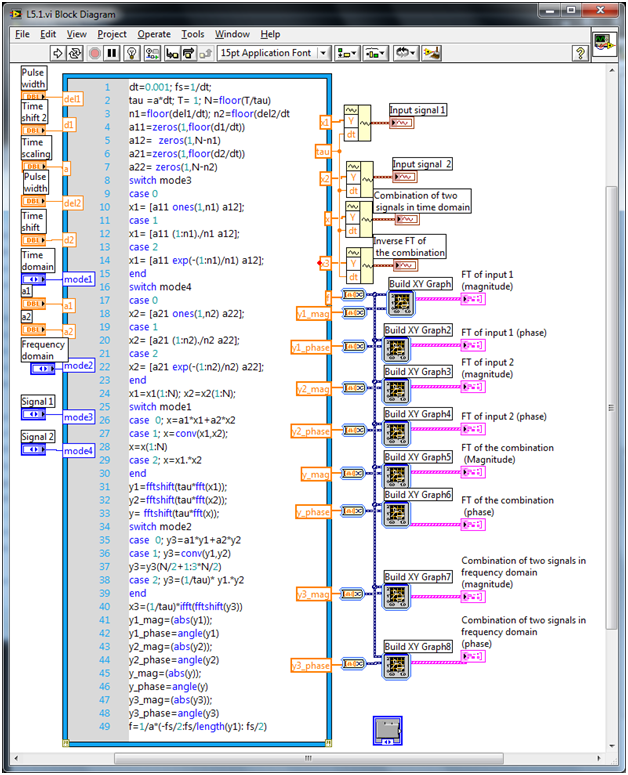
[link] shows the example of the completed block diagram for the CTFT (or FT) and its properties. This particular VI is capable of finding the FT of a rectangular and a triangular pulse. Create two input signals using the LabVIEW MathScript functions ones and zeros, which are combined in the time domain. Use a case structure to select the combination method (linear combination, convolution or multiplication) and the parameter mode1 to serve as an input that is connected to an
Enum Control
(Controls
→
Modern
→
Ring&Enum
→
Enum) . Use parameters mode3 and mode4, which are connected to two Enum controls, to select the input signal type. Also set Pulse width, Time shift and Time scale as control parameters. Pulse width controls the number of ones in the pulse, which is used to increase or decrease the pulse width. Time shift adds zeros before the pulse to provide a time delay. Time scale is set to be multiplied with the time increment (dt) to ensure appropriate scaling of the pulse. Use the LabVIEW MathScript function
fft to determine the FT of the continuous signal. Combine the signals in the frequency domain and control the combination method (linear combination, convolution or multiplication) via the parameter mode2. Compute the FT of the time domain combinations and the inverse FT of the frequency domain combinations using the functions
fft and
ifft . To shift the zero-frequency component to the center of the spectrum, use the LabVIEW MathScript function
fftshift . Finally, determine the magnitude and phase of the FT using the functions
abs and
angle , respectively. Display the input signals and their combinations using a
Build Waveform function
(Functions →
Programming
→
Waveforms
→
Build Waveforms) and a
W
aveform
G
raph
(Controls
→
Modern
→
Graph
→
Waveform Graph) . Also, display the spectrum magnitude and phase using a waveform graph.

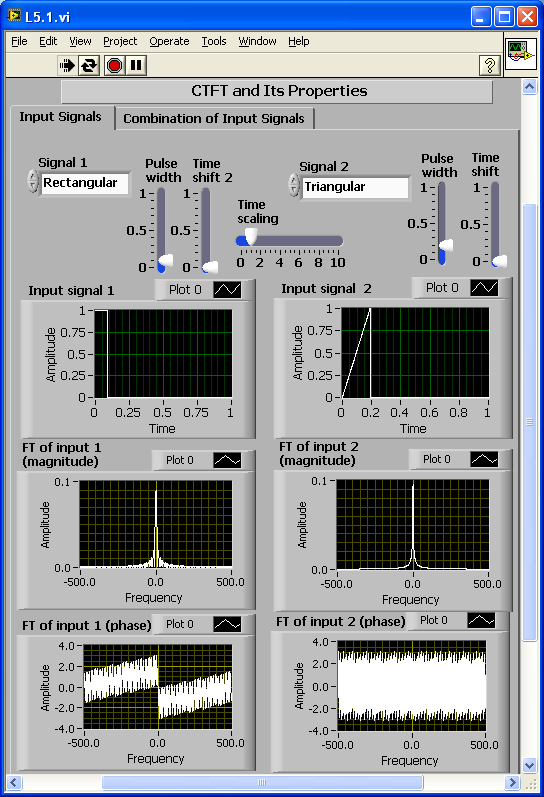
[link] and [link] shows the front panel of the above system. Use controls named Pulse width, Time shift and Time scaling to change the waveforms in the time domain. Three waveform graphs for Input signal, Magnitude of FT and Phase of FT also appear in the front panel shown. With the specified front panel controls, one can easily verify CTFT properties. To begin with, run the program in continuous mode using the Run Continuously button.


Notification Switch
Would you like to follow the 'An interactive approach to signals and systems laboratory' conversation and receive update notifications?