| << Chapter < Page | Chapter >> Page > |
The projection operation can be expanded as another signal processing interpretation emerges. The projection now describes a finite impulse response (FIR) filtering operation evaluated at a specific index. To demonstrate thisinterpretation, let be the unit-sample response of a linear, shift-invariant filterwhere for and . Letting be the filter's input sequence, the convolution sum expresses the output. Letting , the index at which the unit-sample response's last value overlaps the input's value at the origin, we have Suppose we set the unit-sample response equal to the index-reversed, then delayed signal. In this case, the filtering operation becomes a projection operation. [link] depicts these computations graphically.

The sufficient statistic for the signal is thus expressed in signal processing notation as . The filtering term is called a matched filter because the observations are passed through a filter whose unit-sample response "matches" that of the signalbeing sought. We sample the matched filter's output at the precise moment when all of the observations fall within thefilter's memory and then adjust this value by half the signal energy. The adjusted values for the two assumed signals aresubtracted and compared to a threshold.
To compute the performance probabilities, the expressions should
be simplified in the ways discussed in previous sections.As the energy terms are known
Note that the only signal-related quantity affecting this performance probability (and all of the others as well)is the ratio of the energy in the difference signal to the noise variance. The larger this ratio, the better (i.e., smaller) the performance probabilities become. Note that thedetails of the signal waveforms do not greatly affect the energy of the difference signal. For example, consider the case wherethe two signal energies are equal ( ); the energy of the difference signal is given by . The largest value of this energy occurs when the signals are negatives of each other, with the difference-signalenergy equaling . Thus, equal-energy but opposite-signed signals such as sine waves, square-waves, Bessel functions,etc. all yield exactly the same performance levels. The essential signal properties that do yield goodperformance values are elucidated by an alternate interpretation. The term equals , the norm of the difference signal. Geometrically, the difference-signal energy is the same quantity as the square ofthe Euclidean distance between the two signals. In these terms, a larger distance between the two signals means betterperformance.
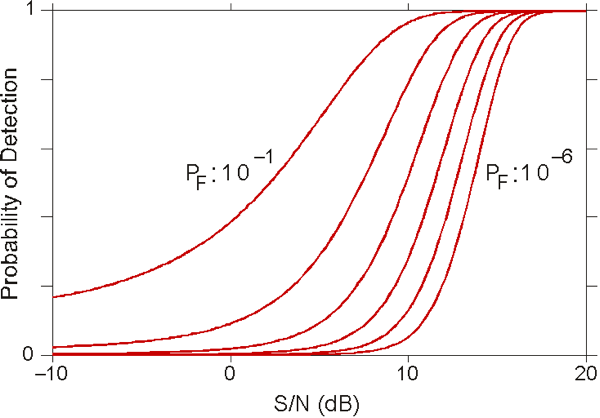
A common detection problem is to determine whether a signal is present ( ) or not ( ). To model the latter case, the signal equals zero: . The optimal detector relies on filtering the data witha matched filter having a unit-sample response based on the signal that might be present. Letting the signal under be denoted simply by , the optimal detector consists of or The false-alarm and detection probabilities are given by [link] displays the probability of detection as a function of the signal-to-noise ratio for several values of false-alarm probability. Given an estimate of the expected signal-to-noise ratio, these curvescan be used to assess the trade-off between the false-alarm and detection probabilities.

The important parameter determining detector performance derived in this example is the signal-to-noise ratio : the larger it is, the smaller the false-alarm probability is (generally speaking). Signal-to-noise ratios can bemeasured in many different ways. For example, one measure might be the ratio of the rms signal amplitude to the rms noiseamplitude. Note that the important one for the detection problem is much different. The signal portion is the sum of the squared signal values over the entire set of observed values - the signal energy; the noise portion is the variance of each noise component - the noise power. Thus, energy can be increased in two ways that increase thesignal-to-noise ratio: the signal can be made larger or the observations can be extended to encompass a larger number of values.
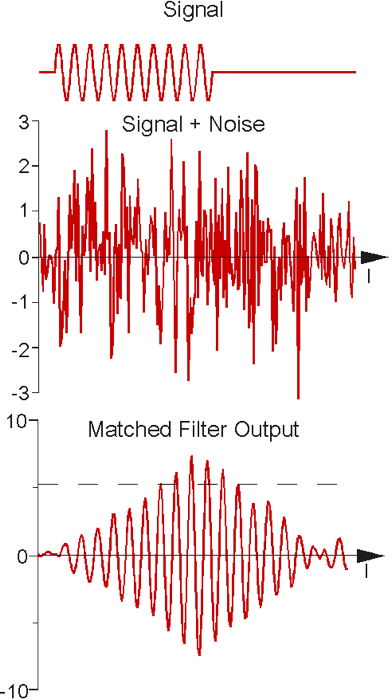
To illustrate this point, how a matched filter operates is shown in [link] . The signal is very difficult to discern in the presence of noise. However, the signal-to-noise ratio that determines detection performancebelies the eye. The matched filter output demonstrates an amazingly clean signal.


Notification Switch
Would you like to follow the 'Statistical signal processing' conversation and receive update notifications?