| << Chapter < Page | Chapter >> Page > |
In this section we will discuss techniques using spreadsheets for exploring probability topics particularly, generating random numbers and use of contingency tables.
Random numbers can be generated in Excel or Google Spreadsheet. To create a random number, column of numbers, or a page of numbers you would use the formula =rand() in any cell, copy and paste that same formula to any other cell and you have a list of random numbers. The rand formula gives you a decimal random number between 0.0000 and 1.0000 so if you do not want a decimal random number that you can enter =rand()*1000 in a worksheet cell you will then have a whole number between 9999 and 0000.
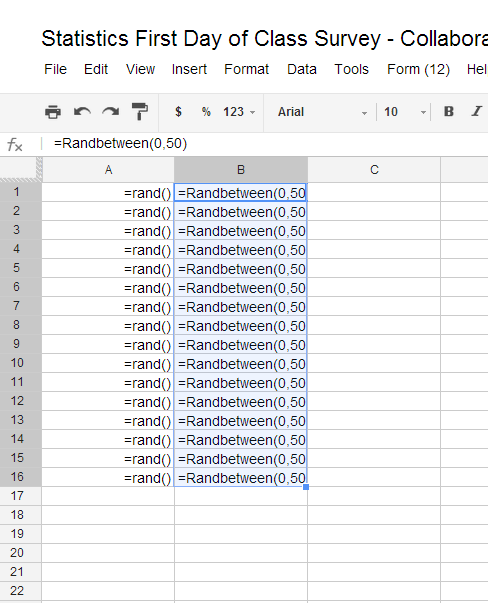
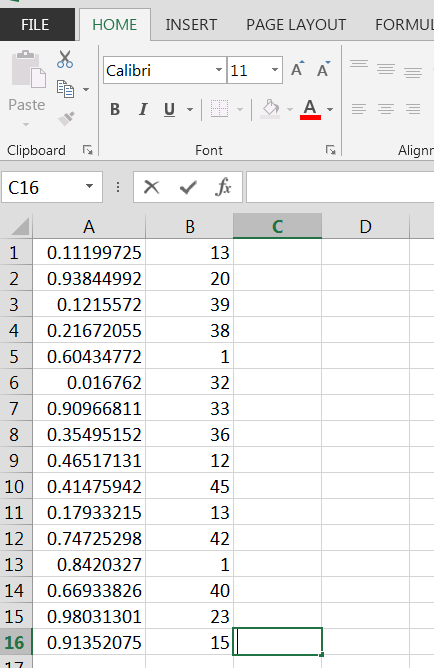
Both Excel and Google Spreadsheet also have a function called =randbetween(lower bound, upper bound) where you can specify your numbers. To use this function you will pick your lower and upper bounds. So if you want a random list of numbers between 0 and 50 you would enter =randbetween(0,50). Again if you copy and paste this formula into multiple cells you will have a list of random numbers within your criteria. See image below of numbers generated using Excel and Google Spreadsheet. The first row has numbers generated using =rand() the second column has numbers generated using =randbetween(0,50). Note though that if you want stable numbers that will not change every time you open the spreadsheet you will need to use the copy function and paste as “value” into a column to make the numbers static.


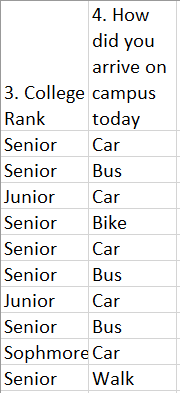
Given the data set of “College Rank” and “How did you arrive on campus today?” let’s figure out some probabilities using Excel PivotTable. Below is the data we will use.

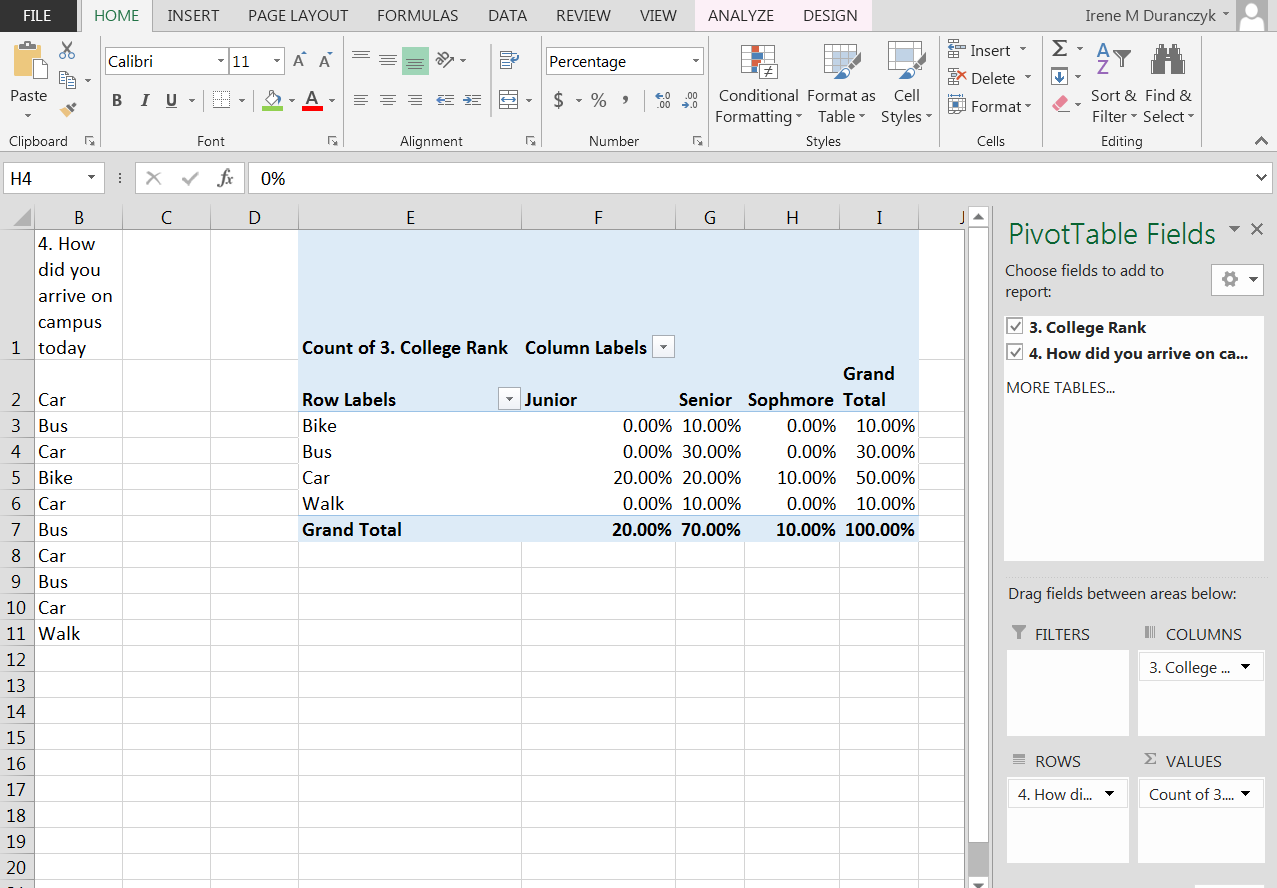
We will create a PivotTable using the same techniques as we did for Bivariate Data. We can keep the counts if we want to calculate the percentages by hand to determine the probability of any particular event or we can alter the “Values” field by using the down arrow next to “count”, pick “Value Field Setting” from the pull down menu and then go to the tab called, “Show Values As” and pick “% of Grand Total”. That will give you all the probabilities of the particular events out of all possible events. In this example the probability of a selecting a senior who drives a car would be .2 or 20% or the probability of selecting a student who arrived at school today by car would be 50%. Think of what other questions you could answer.

At your computer, try this exercise: (1) Open the file, Statistics First Day of Class Survey that you worked on previously (2) open the file in Excel or Google Spreadsheet (3) create a new worksheet tab and label it Probability topics; (4) pick two columns of categorical that have been “cleaned” and create a pivot table; (4) determine the probability of at least 4 events of interest to you. (6) copy your pivot table and your questions into a word document and describe the probability of your selected data. (7) save the Excel or file again and this time post only the word document you created in the appropriate Moodle assignment.
There is a wonderful web site call Random.org http://www.random.org/ that has some free tools to explore random events and probability. On the Random.org home webpage there is a category called “Games and Gambling.” If you mouse over “Coin Flipper”, “Dice Roller” or “playing Card Shuffler” and click on it, you will be able to explore random events. You will be able to choose the number of events you want to generate and some display options. Try it to generate a sample space.

Notification Switch
Would you like to follow the 'Collaborative statistics using spreadsheets' conversation and receive update notifications?