| << Chapter < Page | Chapter >> Page > |
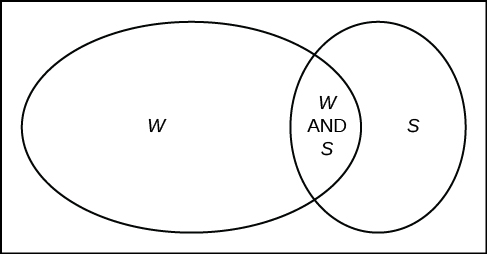
Fifty percent of the workers at a factory work a second job, 25% have a spouse who also works, 5% work a second job and have a spouse who also works. Draw a Venn diagram showing the relationships. Let W = works a second job and S = spouse also works.

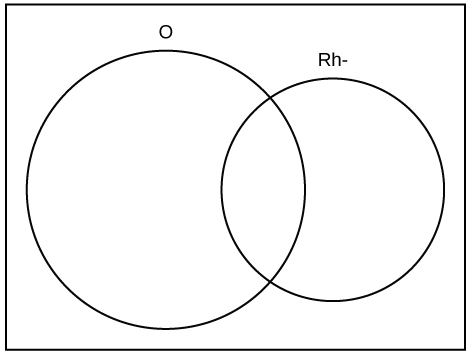
A person with type O blood and a negative Rh factor (Rh-) can donate blood to any person with any blood type. Four percent of African Americans have type O blood and a negative RH factor, 5−10% of African Americans have the Rh- factor, and 51% have type O blood.

The “O” circle represents the African Americans with type O blood. The “Rh-“ oval represents the African Americans with the Rh- factor.
We will take the average of 5% and 10% and use 7.5% as the percent of African Americans who have the Rh- factor. Let O = African American with Type O blood and R = African American with Rh- factor.
a. 0.51; b. 0.075; c. 0.04; d. 0.545; e. The area represents the African Americans that have type O blood and the Rh- factor. f. The area represents the African Americans that have neither type O blood nor the Rh- factor.
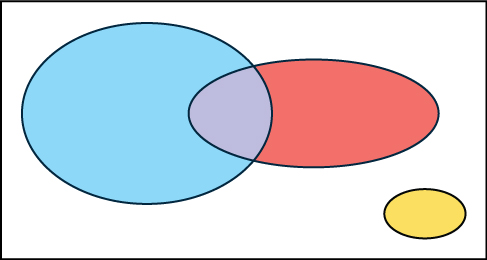
In a bookstore, the probability that the customer buys a novel is 0.6, and the probability that the customer buys a non-fiction book is 0.4. Suppose that the probability that the customer buys both is 0.2.
a. and d. In the following Venn diagram below, the blue oval represent customers buying a novel, the red oval represents customer buying non-fiction, and the yellow oval customer who buy compact disks.

b.
P (novel or non-fiction) =
P (Blue OR Red) =
P (Blue) +
P (Red) -
P (Blue AND Red) = 0.6 + 0.4 - 0.2 = 0.8.
c. The overlapping area of the blue oval and red oval represents the customers buying both a novel and a nonfiction book.
Data from Clara County Public H.D.
Data from the American Cancer Society.
Data from The Data and Story Library, 1996. Available online at http://lib.stat.cmu.edu/DASL/ (accessed May 2, 2013).
Data from the Federal Highway Administration, part of the United States Department of Transportation.
Data from the United States Census Bureau, part of the United States Department of Commerce.
Data from USA Today.
“Environment.” The World Bank, 2013. Available online at http://data.worldbank.org/topic/environment (accessed May 2, 2013).
“Search for Datasets.” Roper Center: Public Opinion Archives, University of Connecticut., 2013. Available online at http://www.ropercenter.uconn.edu/data_access/data/search_for_datasets.html (accessed May 2, 2013).

Notification Switch
Would you like to follow the 'Introduction to statistics i - stat 213 - university of calgary - ver2015revb' conversation and receive update notifications?