<< Chapter < Page Chapter >> Page >
This module introduces Venn diagrams as a method for solving some probability problems. This module is included in the Elementary Statistics textbook/collection as an optional lesson.

A Venn diagram is a picture that represents the outcomes of an experiment. It generally consists of a box that represents the sample space S together with circles or ovals. The circles or ovals represent events.

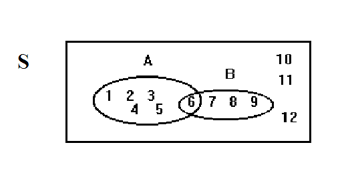
Suppose an experiment has the outcomes 1, 2, 3, ... , 12 where each outcome has an equal chance of occurring. Let event A = {1, 2, 3, 4, 5, 6} and event B = {6, 7, 8, 9} . Then A AND B = {6} and A OR B = {1, 2, 3, 4, 5, 6, 7, 8, 9} . The Venn diagram is as follows:

A Venn diagram. An oval representing set A contains the values 1, 2, 3, 4, 5, and 6. An oval representing set B also contains the 6, along with 7, 8, and 9. The values 10, 11, and 12 are present but not contained in either set.

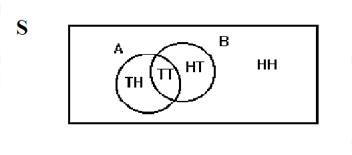
Flip 2 fair coins. Let A = tails on the first coin. Let B = tails on the second coin. Then A = { TT , TH } and B = { TT , HT } . Therefore, A AND B = { TT } . A OR B = { TH , TT , HT } .

The sample space when you flip two fair coins is S = { HH , HT , TH , TT } . The outcome HH is in neither A nor B . The Venn diagram is as follows:

Venn diagram with set A containing Tails + Heads and Tails + Tails, and set B containing Tails + Tails and Head + Tails. Head + Heads is contained in neither set, and set A and set B share Tails + Tails.

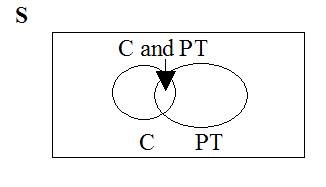
Forty percent of the students at a local college belong to a club and 50% work part time. Five percent of the students work part time and belong to a club. Draw a Venn diagram showing the relationships. Let C = student belongs to a club and PT = student works part time.

Venn diagram with one set containing students in clubs and students in clubs and working part-time and another set containing C/PT and students working part-time. Both sets share  C/PT.

If a student is selected at random find

  • The probability that the student belongs to a club. P(C) = 0.40 .
  • The probability that the student works part time. P(PT) = 0.50 .
  • The probability that the student belongs to a club AND works part time. P(C AND PT) = 0.05 .
  • The probability that the student belongs to a club given that the student works part time.
    P(C|PT)  =  P(C AND PT) P(PT)  =  0.05 0.50  =  0.1
  • The probability that the student belongs to a club OR works part time.
    P(C OR PT) = P(C) + P(PT) - P(C AND PT) = 0.40 + 0.50 - 0.05 = 0.85
Practice Key Terms 1

Get Jobilize Job Search Mobile App in your pocket Now!

Get it on Google Play Download on the App Store Now


Source:  OpenStax, Collaborative statistics using spreadsheets. OpenStax CNX. Jan 05, 2016 Download for free at http://legacy.cnx.org/content/col11521/1.23
Google Play and the Google Play logo are trademarks of Google Inc.

Notification Switch

Would you like to follow the 'Collaborative statistics using spreadsheets' conversation and receive update notifications?

Ask