| << Chapter < Page | Chapter >> Page > |
Characteristics of a Poisson experiment:
The average number of loaves of bread put on a shelf in a bakery in a half-hour period is 12. Of interest is the number of loaves of bread put on the shelf in 5 minutes. Thetime interval of interest is 5 minutes. What is the probability that the number of loaves, selected randomly, put on the shelf in 5 minutes is 3?
Let = the number of loaves of bread put on the shelf in 5 minutes. If the average number of loaves put on the shelf in 30 minutes (half-hour) is 12, then the average number of loaves put on the shelf in 5 minutes is
loaves of bread
The probability question asks you to find .
A certain bank expects to receive 6 bad checks per day, on average. What is the probability of the bank getting fewer than 5 bad checks on any given day? Of interestis the number of checks the bank receives in 1 day, so the time interval of interest is 1 day. Let = the number of bad checks the bank receives in one day. If the bank expects to receive 6 bad checks per day then the average is 6 checks per day.The probability question asks for .
You notice that a news reporter says "uh", on average, 2 times per broadcast. What is the probability that the news reporter says "uh" more than 2 times per broadcast.
This is a Poisson problem because you are interested in knowing the number of times the news reporter says "uh" during a broadcast.
What is the interval of interest?
One broadcast
What is the average number of times the news reporter says "uh" during one broadcast?
2
Let = ____________. What values does take on?
Let
=
the number of times the news reporter says "uh" during one broadcast .
= 0, 1, 2, 3, ...
The probability question is .
~
Read this as " is a random variable with a Poisson distribution." The parameter is (or ). (or ) = the mean for the interval of interest.
Leah's answering machine receives about 6 telephone calls between 8 a.m. and 10 a.m. What is the probability that Leah receives more than 1 call in the next 15 minutes?
Let = the number of calls Leah receives in 15 minutes. (The interval of interest is 15 minutes or hour.)
= 0, 1, 2, 3, ...
If Leah receives, on the average, 6 telephone calls in 2 hours, and there are eight 15 minutes intervals in 2 hours, then Leah receives
calls in 15 minutes, on the average. So, = 0.75 for this problem.
~
Find . (calculator or computer)
TI-83+ and TI-84: For a general discussion, see this example (Binomial) . The syntax is similar. The Poisson parameter list is ( for the interval of interest, number). For this problem:
Press 1- and then press 2nd DISTR. Arrow down to C:poissoncdf. Press ENTER. Enter .75,1). The result is . NOTE: The TI calculators use (lambda) for the mean.
The probability that Leah receives more than 1 telephone call in the next fifteen minutes is about 0.1734.
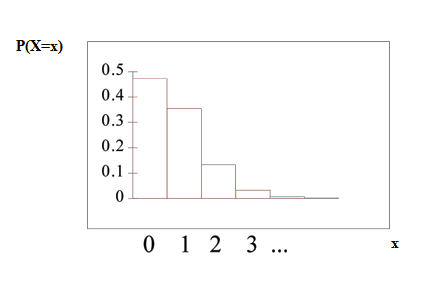
The graph of ~ is:

The y-axis contains the probability of where = the number of calls in 15 minutes.

Notification Switch
Would you like to follow the 'Quantitative information analysis iii' conversation and receive update notifications?