<< Chapter < Page Chapter >> Page >
In MP3 and AAC coders, the frequency resolution of the polyphase quadrature filterbank is increased using a cascaded MDCT stage. We describe that here, and give the details of the MDCT stage.

Mdct filterbanks

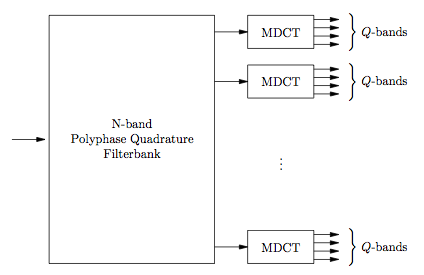
  • Hybrid Filter Banks: In more advanced audio coders such as MPEG “Layer-3” or MPEG“Advanced Audio Coding” (the details of which will be discussed later), the 32-band polyphase quadrature filterbank (PQF) is thought to not giveadequate frequency resolution, and so an additional stage of frequency division is cascaded onto the output of the PQF.This additional frequency division is accomplished using the so-called “Modified DCT” (MDCT) filterbank.(See [link] .)
    This is a flowchart with general movement to the right, beginning with a single arrow pointing to the right at a large box labeled N-band Polyphase Quadrature Filterbank. From the right edge of this bos are a series of arrows that each point at a series of boxes, all labeled MDCT. From each MDCT box there are four arrows of equal length and size pointing to the right, and these groups of arrows are labeled Q-bands. This is a flowchart with general movement to the right, beginning with a single arrow pointing to the right at a large box labeled N-band Polyphase Quadrature Filterbank. From the right edge of this bos are a series of arrows that each point at a series of boxes, all labeled MDCT. From each MDCT box there are four arrows of equal length and size pointing to the right, and these groups of arrows are labeled Q-bands.
    Hybrid filterbank scheme used in MPEG Layer-3 (where N = 32 and Q switches bewteen 6 and 18) and MPEG AAC (where N = 4 and Q switches between 128 and 1024).
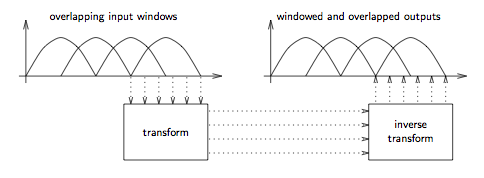
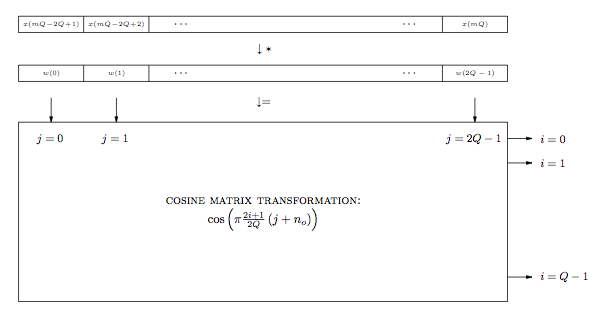
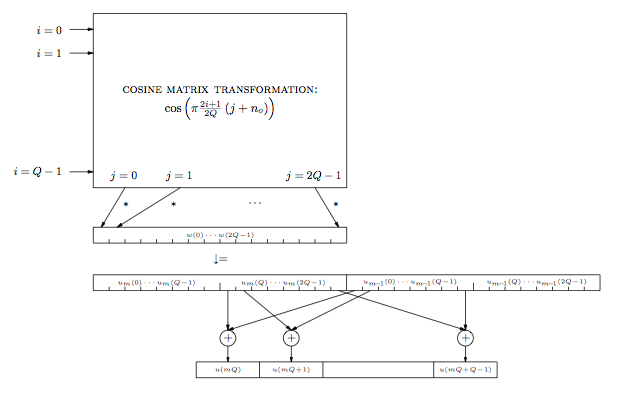
  • Lapped Transforms: The MDCT is a so-called “lapped transform.”At the encoder, blocks of length 2 Q which overlap by Q samples are windowed and transformed, generating Q subband samples each. At the decoder, the Q subband samples are inverse-transformed and windowed.The windowed output samples are overlapped with and added to the previous Q windowed outputs to form the output stream. [link] gives an intuitive view of the coding/decoding operation, while [link] and [link] specify the specific coder/decoder implementations used in the MPEG schemes.
    This is a flowchart that contains two cartesian graphs, each with four peaked waves, and two boxes, with arrows in between the objects showing movement. The first graph is labeled overlapping input windows, and contains four peaks, with bases overlapping so that the beginning of each wave begins at the midpoint of the preceding wave. Below the right half of the horizontal axis are six dashed arrows that point down at a box labeled transform. To the right of this box are four dashed arrows that point to the right at a box labeled inverse transform. Above the inverse transform box are six more dashed arrows that point up at the second graph, which is visually identical to the first graph, except that it is labeled windowed and overlapped outputs. This is a flowchart that contains two cartesian graphs, each with four peaked waves, and two boxes, with arrows in between the objects showing movement. The first graph is labeled overlapping input windows, and contains four peaks, with bases overlapping so that the beginning of each wave begins at the midpoint of the preceding wave. Below the right half of the horizontal axis are six dashed arrows that point down at a box labeled transform. To the right of this box are four dashed arrows that point to the right at a box labeled inverse transform. Above the inverse transform box are six more dashed arrows that point up at the second graph, which is visually identical to the first graph, except that it is labeled windowed and overlapped outputs.
    A lapped transform.
    This figure is a large flowchart with a general downward direction. It begins with a series of connected boxes labeled across from left to right in a pattern x(mQ- 2Q + 1), x(mQ -2Q +2) and so on to x(mQ). Below these boxes is a single arrow labeled with an asterisk that points down at a second row of connected rectangles with the series of labels w(0), w(1), and so on to w(2Q - 1). Below these rectangles is a single small arrow pointing down labeled with an equal sign, and a series of larger arrows pointing down at a large box labeled Cosine Matrix Transformation. The positions in which the larger arrows point at the large box are labeled in a series from j = 0 to j = 2Q -1. To the right of the box are a series of arrows pointing to the right at the equations that read from top to bottom, i = 0, i = 1, and so on to a final equation,  i = Q - 1. This figure is a large flowchart with a general downward direction. It begins with a series of connected boxes labeled across from left to right in a pattern x(mQ- 2Q + 1), x(mQ -2Q +2) and so on to x(mQ). Below these boxes is a single arrow labeled with an asterisk that points down at a second row of connected rectangles with the series of labels w(0), w(1), and so on to w(2Q - 1). Below these rectangles is a single small arrow pointing down labeled with an equal sign, and a series of larger arrows pointing down at a large box labeled Cosine Matrix Transformation. The positions in which the larger arrows point at the large box are labeled in a series from j = 0 to j = 2Q -1. To the right of the box are a series of arrows pointing to the right at the equations that read from top to bottom, i = 0, i = 1, and so on to a final equation,  i = Q - 1.
    MDCT filterbank: encoder implementation.
    This figure is a large flowchart that moves generally downward. It begins with a large box labeled Cosine matrix transformation. To the left of this box are a series of arrows pointing at the box that are labeled with the equations, i = 0,  i = 1, and so on to i = Q - 1. At the base of this box are the equations j = 0, j = 1, and so on in the series to  j = 2Q - 1. From each of these equations in the series at the base are arrows labeled with asterisks pointing at different segments of a long rectangle containing hash marks. Inside the long rectangle is the label w(0) . . . w(2Q - 1). Below this rectangle is a single arrow pointing down, labeled with an equal sign, at two connected rectangles with the same width and same number of hash marks. Each of the connected rectangles is then divided into two segments because the middle hash mark is longer. The segments, from left to right, contain the captions u_m(0) . . . u_m(Q - 1), u_m(Q) . . . u_m(2Q - 1), u_m-1(0) . . . u_m-1(Q-1), and u_m-1(Q) . . . u_m-1(2Q-1). From certain points along these rectangles are arrows pointing at a row of circles containing a plus sign. below each circle is an arrow pointing down at a final row of connected boxes, labeled u(mQ) to u(mQ + Q - 1). This figure is a large flowchart that moves generally downward. It begins with a large box labeled Cosine matrix transformation. To the left of this box are a series of arrows pointing at the box that are labeled with the equations, i = 0,  i = 1, and so on to i = Q - 1. At the base of this box are the equations j = 0, j = 1, and so on in the series to  j = 2Q - 1. From each of these equations in the series at the base are arrows labeled with asterisks pointing at different segments of a long rectangle containing hash marks. Inside the long rectangle is the label w(0) . . . w(2Q - 1). Below this rectangle is a single arrow pointing down, labeled with an equal sign, at two connected rectangles with the same width and same number of hash marks. Each of the connected rectangles is then divided into two segments because the middle hash mark is longer. The segments, from left to right, contain the captions u_m(0) . . . u_m(Q - 1), u_m(Q) . . . u_m(2Q - 1), u_m-1(0) . . . u_m-1(Q-1), and u_m-1(Q) . . . u_m-1(2Q-1). From certain points along these rectangles are arrows pointing at a row of circles containing a plus sign. below each circle is an arrow pointing down at a final row of connected boxes, labeled u(mQ) to u(mQ + Q - 1).
    MDCT filterbank: decoder implementation.
  • Perfect Reconstruction: Based on the cancellation of time-domain aliasing components, Princen, Johnson,&Bradley show (in ICASSP 87 and TASSP 86 papers) that the MDCT acheives perfect-reconstruction when window { w n } is chosen so that overlapped squared copies sum to one, i.e.,
    1 = w n + Q 2 + w n 2 for 0 n Q - 1 .
    The “sine” window
    w n = sin π 2 Q n for 0 n 2 Q - 1
    is one example of a window satisfying this requirement, and it turns out to be the one used in MPEG Layer-3.
  • Frequency Resolution: With a window length that is only twice the number of transformoutputs, we cannot expect very good frequency selectivity. But, it turns out that this is not a problem.In MPEG Layer-3, sine-window MDCTs appear at the outputs of a 32-band PQF where frequency selectivity is not a critical issue due to thelimited frequency resolution of the human ear. In MPEG AAC, a 4-band PQF in conjunction with an optimized MDCT windowfunction gives frequency selectivity just above that which current psychoacoustic models deem necessary (see M. Bosi et al., "ISO/IEC MPEG-2 Advanced Audio Coding" in JAES Oct 1997).
  • Window Switching: Larger values of Q lead to increased frequency resolution but decreased time resolution.Time resolution is linked to the following: error due to the quantization of one MDCT output is spread out over 2 Q N time-domain output samples. For signals of a transient nature, choosing Q N too high leads to audible “pre-echoes.”For less transient signals, on the other hand, the same value of Q N might not be perceptible (and the increased frequency resolution might be very beneficial).Hence, most advanced coding schemes have a provision to switch between different time/frequency resolutions depending on localsignal behavior. In MPEG Layer-3, for example, Q switches between 6 and 18. This is accomplished using a sine window of length 36, a sinewindow of length 12, and intermediate windows which are used to switch between the long and short windows while retaining theperfect reconstruction property. [link] shows an example window sequence.
    this figure is a graph of nine peaked waves, each beginning and ending at the horizontal axis. They have equal amplitudes, but the wavelengths decrease incrementally until the fifth wave, which has the shortest wavelength, and then they increase symmetrically back to the maximum wavelengths of the first and ninth waves. In shape, the waves are not sinusoidal, most resembling a parabolic shape, except for the third and seventh waves, which begin with a wide ascension to maximum amplitude on the outside, continue with a horizontal segment at their local maxima, and then descend sharply with wavelengths comparable to the fourth and sixth waves. this figure is a graph of nine peaked waves, each beginning and ending at the horizontal axis. They have equal amplitudes, but the wavelengths decrease incrementally until the fifth wave, which has the shortest wavelength, and then they increase symmetrically back to the maximum wavelengths of the first and ninth waves. In shape, the waves are not sinusoidal, most resembling a parabolic shape, except for the third and seventh waves, which begin with a wide ascension to maximum amplitude on the outside, continue with a horizontal segment at their local maxima, and then descend sharply with wavelengths comparable to the fourth and sixth waves.
    Example MDCT window sequence for MPEG Layer-3.

Get Jobilize Job Search Mobile App in your pocket Now!

Get it on Google Play Download on the App Store Now


Source:  OpenStax, An introduction to source-coding: quantization, dpcm, transform coding, and sub-band coding. OpenStax CNX. Sep 25, 2009 Download for free at http://cnx.org/content/col11121/1.2
Google Play and the Google Play logo are trademarks of Google Inc.

Notification Switch

Would you like to follow the 'An introduction to source-coding: quantization, dpcm, transform coding, and sub-band coding' conversation and receive update notifications?

Ask