| << Chapter < Page | Chapter >> Page > |
If demand is more inelastic than supply, consumers bear most of the tax burden, and if supply is more inelastic than demand, sellers bear most of the tax burden.
The intuition for this is simple. When the demand is inelastic, consumers are not very responsive to price changes, and the quantity demanded remains relatively constant when the tax is introduced. In the case of smoking, the demand is inelastic because consumers are addicted to the product. The government can then pass the tax burden along to consumers in the form of higher prices, without much of a decline in the equilibrium quantity.
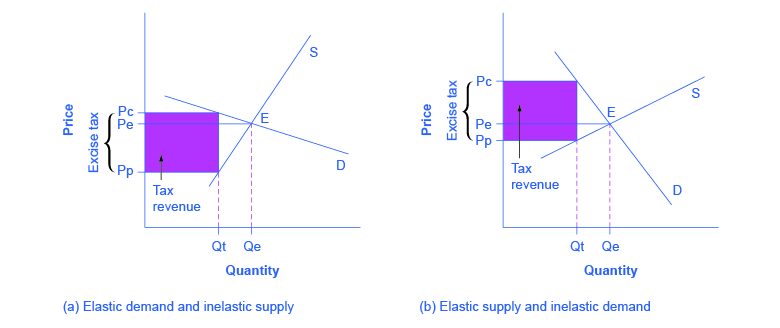
Similarly, when a tax is introduced in a market with an inelastic supply, such as, for example, beachfront hotels, and sellers have no alternative than to accept lower prices for their business, taxes do not greatly affect the equilibrium quantity. The tax burden is now passed on to the sellers. If the supply was elastic and sellers had the possibility of reorganizing their businesses to avoid supplying the taxed good, the tax burden on the sellers would be much smaller. The tax would result in a much lower quantity sold instead of lower prices received. [link] illustrates this relationship between the tax incidence and elasticity of demand and supply.

In [link] (a), the supply is inelastic and the demand is elastic, such as in the example of beachfront hotels. While consumers may have other vacation choices, sellers can’t easily move their businesses. By introducing a tax, the government essentially creates a wedge between the price paid by consumers Pc and the price received by producers Pp. In other words, of the total price paid by consumers, part is retained by the sellers and part is paid to the government in the form of a tax. The distance between Pc and Pp is the tax rate. The new market price is Pc, but sellers receive only Pp per unit sold, as they pay Pc-Pp to the government. Since a tax can be viewed as raising the costs of production, this could also be represented by a leftward shift of the supply curve, where the new supply curve would intercept the demand at the new quantity Qt. For simplicity, [link] omits the shift in the supply curve.
The tax revenue is given by the shaded area, which is obtained by multiplying the tax per unit by the total quantity sold Qt. The tax incidence on the consumers is given by the difference between the price paid Pc and the initial equilibrium price Pe. The tax incidence on the sellers is given by the difference between the initial equilibrium price Pe and the price they receive after the tax is introduced Pp. In [link] (a), the tax burden falls disproportionately on the sellers, and a larger proportion of the tax revenue (the shaded area) is due to the resulting lower price received by the sellers than by the resulting higher prices paid by the buyers. The example of the tobacco excise tax could be described by [link] (b) where the supply is more elastic than demand. The tax incidence now falls disproportionately on consumers, as shown by the large difference between the price they pay, Pc, and the initial equilibrium price, Pe. Sellers receive a lower price than before the tax, but this difference is much smaller than the change in consumers’ price. From this analysis one can also predict whether a tax is likely to create a large revenue or not. The more elastic the demand curve, the easier it is for consumers to reduce quantity instead of paying higher prices. The more elastic the supply curve, the easier it is for sellers to reduce the quantity sold, instead of taking lower prices. In a market where both the demand and supply are very elastic, the imposition of an excise tax generates low revenue.

Notification Switch
Would you like to follow the 'Openstax microeconomics in ten weeks' conversation and receive update notifications?