| << Chapter < Page | Chapter >> Page > |
If then we have one intercept at .
For example, the -intercepts of is given by setting to get:
which is not real. Therefore, the graph of does not have any -intercepts.
The turning point of the function of the form is given by examining the range of the function. We know that if then the range of is and if then the range of is .
So, if , then the lowest value that can take on is . Solving for the value of at which gives:
at . The co-ordinates of the (minimal) turning point is therefore .
Similarly, if , then the highest value that can take on is and the co-ordinates of the (maximal) turning point is .
There is one axis of symmetry for the function of the form that passes through the turning point. Since the turning point lies on the -axis, the axis of symmetry is the -axis.
In order to sketch graphs of the form, , we need to determine five characteristics:
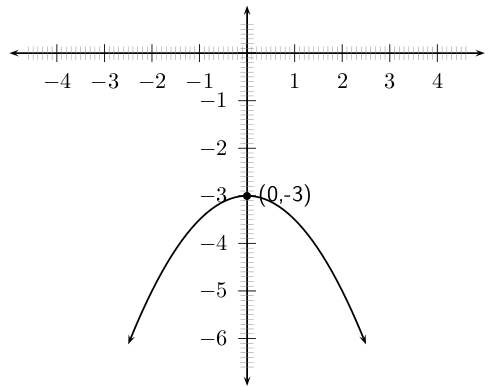
For example, sketch the graph of . Mark the intercepts, turning point and axis of symmetry.
Firstly, we determine that . This means that the graph will have a maximal turning point.
The domain of the graph is because is defined for all . The range of the graph is determined as follows:
Therefore the range of the graph is .
Using the fact that the maximum value that achieves is -3, then the -coordinate of the turning point is -3. The -coordinate is determined as follows:
The coordinates of the turning point are: .
The -intercept is obtained by setting . This gives:
The -intercept is obtained by setting . This gives:
which is not real. Therefore, there are no -intercepts which means that the function does not cross or even touch the -axis at any point.
We also know that the axis of symmetry is the -axis.
Finally, we draw the graph. Note that in the diagram only the y-intercept is marked. The graph has a maximal turning point (i.e. makes a frown) as determined from the sign of a, there are no x-intercepts and the turning point is that same as the y-intercept. The domain is all real numbers and the range is .

The following video shows one method of graphing parabolas. Note that in this video the term vertex is used in place of turning point. The vertex and the turning point are the same thing.
Khan academy video on graphing parabolas - 1


Notification Switch
Would you like to follow the 'Siyavula textbooks: grade 10 maths [ncs]' conversation and receive update notifications?