| << Chapter < Page | Chapter >> Page > |
b) Now throw the di 15 times. In the space below make a tick (√) every time the 3 lands on top.
Now write the total number of ticks as a fraction where the denominator is 15. _____________________________________________________________________
Is your answer close to one sixth (use your calculator) _________________________
Can you explain this? __________________________________________________
_____________________________________________________________________
20.5 Did you know?
It would be pure chance if you achieved a probability of one sixth in the above activity. Practical probability is based on what you actually did. Theoretical probability is only an attempt to predict what might happen.
The more times that you throw the di, the closer the practical
and theoretical probabilities should come to each other.
20.6 BRAINTEASER
_____________________________________________________________________
_____________________________________________________________________
21. Time for self-assessment
|
|||
| I can explain the concept “probability”. |
 |
 |
 |
| I know what a probability of 0 means. |
 |
 |
 |
| know what a probability of 1 means. |
 |
 |
 |
| I know the “formula” to determine probability. |
 |
 |
 |
| I was able to correctly calculate the probability in the given questions. |
 |
 |
 |
22. For FUN!
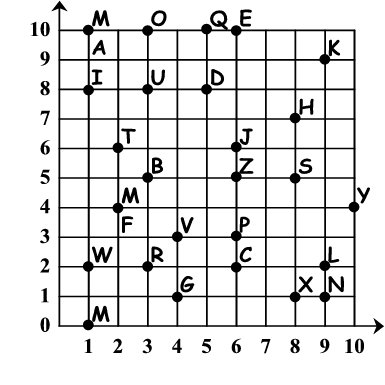
(9,9) (9,2) (1,10) (1,10) (3,2) (1,0) (6,10) (2,6)
............................................ .........................
(4,1) (3,2) (1,10) (1,10) (5,8) (8,5) (6,10) (1,2) (6,10)
............................................ ......................................
(8,5) (6,10) (1,2) (1,8) (8,5) (9,9) (3,8) (9,1) (5,8) (6,10)!!
................. ......................................................................!!

Learning Outcome 5: The learner will be able to collect, summarise, display and critically analyse data in order to draw conclusions and make predictions, and to interpret and determine chance variation.
Assessment Standard 5.9: We know this when the learner critically reads and interprets data presented in a variety of ways to draw conclusions and make predictions sensitive.
Assessment Standard 5.10: We know this when the learner performs simple experiments where the possible outcomes are equally likely.
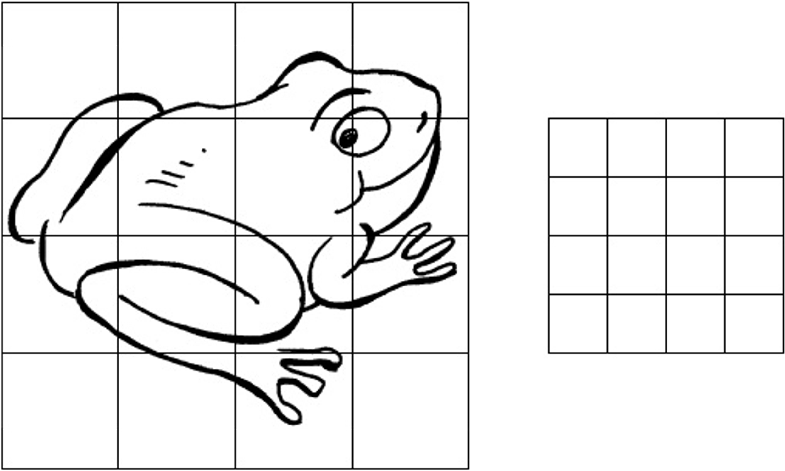
1. Reduce the frog on a scale 2:1.

(3)
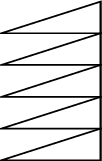
2. What kind of transformation was in the following figure?

_____________________________________________
(1)
3. Explain the following concepts:
a) random test: ____________________________________________________
_____________________________________________________________________
_____________________________________________________________________
(2)
b) probability: _____________________________________________________
_____________________________________________________________________
_____________________________________________________________________
(2)
4. Look at the following:
A group of learners’ marks out of 15 were as follows:
6; 11 ; 12 ; 15 ; 9 ; 10 ; 10 ; 10 ; 8 ; 15
a) Calculate the mode:_______________________________________________
_____________________________________________________________________
_____________________________________________________________________
(2)
b) Calculate the median: _____________________________________________
_____________________________________________________________________
_____________________________________________________________________
(2)
c) Calculate the arithmetic mean (average): ______________________________
_____________________________________________________________________
_____________________________________________________________________
(2)
5. Study the graph and answer the following questions:

a) What is this type of graph called?
_____________________________________________________________________
(1)
b) Why does it “jump” from 0 to 6?
_____________________________________________________________________
_____________________________________________________________________
(1)
c) How many learners are 7 years old?
_____________________________________________________________________
(1)
d) How many more 9 year old learners are there than 12 year olds?
_____________________________________________________________________
(1)
e) How many learners are there in the school?
_____________________________________________________________________
(1)
6. Represent the information given in question on a line graph.
(3)
7. What is the probability that you will take a black ball from a container containing 12 red, 6 green, 4 black, 2 yellow and 8 blue balls?
_____________________________________________________________________
_____________________________________________________________________
_____________________________________________________________________
_____________________________________________________________________
(2)

Notification Switch
Would you like to follow the 'Mathematics grade 7' conversation and receive update notifications?