| << Chapter < Page | Chapter >> Page > |
14.1 – 14.5 Check learner’s efforts
14.4 Fanta
14.5 R25,00
15.1 (a) half past eight
(b) 1 hour 40 min
(c) 53 min
(d) half past six
(e) 55 min
(f) 18 hours
15.2 (a) 14 000 km
(b) 14,7 hours
(c) approximately 7 200 km
(d) 600 km/h
(e) approximately 49 and a half
(f) 12 hours 47 min
(g) 08:05
(h) 07:05
(i) “Daylight saving” –use as much sun as possible.
(j) USA
14. OWN REPRESENTATION OF DATA:
14.1 Vusi, a learner in Grade 7, was seriously sick and had to go to hospital. The nurse took his temperature regularly
08:00 37,8º
10:00 38,2º
12:00 38,4º
14:00 37,6º
16:00 38º
18:00 39,2º
20:00 38,8º
14.2 In a certain town water is consumed as follows:
gardening 32%
laundry and dishes 15%
toilets 28%
bathing 20%
cooking and drinking 5%
14.3 During the election of prefects at Sunshine Primary School, Stephanie received 80 votes, Tamara received 120 votes, Buck 60 votes and Sean 140 votes.
14.4 Draw a column/bar graph to represent the sales of cool drink during the year:
Lemonade 22 000 litres
Fanta 38 000 litres
Coke 45 500 litres
Cream soda 20 500 litres
Tab 43 250 litres
_____________________________________________________________________
_____________________________________________________________________
_____________________________________________________________________
14.5 BRAIN-TEASER!
Jan Feb Mar Apr May
| Jan | Feb | Mar | Apr | May | |
| Price of Cheddar cheese per kg | R12.50 | R15.00 | R12.50 | R17.50 | R22.50 |
| Price of Sweet milk cheese per kg | R17.50 | R22.50 | R12.50 | R20.00 | R25.00 |
(Hint: draw up a double column graph!)
_____________________________________________________________________
_____________________________________________________________________
_____________________________________________________________________
_____________________________________________________________________
_____________________________________________________________________
_____________________________________________________________________
15. INTERPRETATION OF DATA
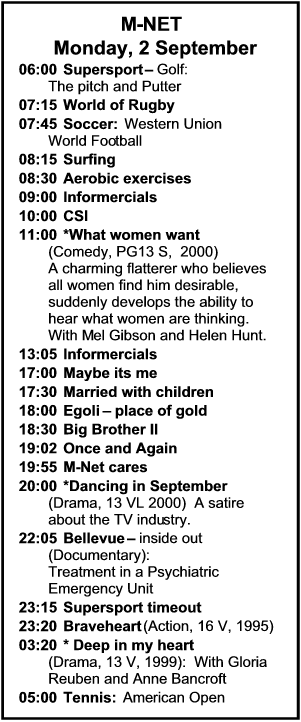
15.1 Look at the TV guide and answer the following questions.

a) At what time can you look at the aerobic exercises? _____________________
b) How long is the drama “Deep in my Heart”? ___________________________
c) How long is the program “Once and Again”?___________________________
d) At what time can you watch Big Brother II____________________________
e) How long must you wait after “What women want” before you can watch KTV _______________________________________________________________
f) How long is the whole broadcast on this particular day? __________________
g) How much time do YOU spend every day, on average, watching TV? ______
15.2 Study the world map and the given scale and determine:
a) What is the distance from Cape Town to New York? ____________________
b) If an aeroplane flies at 950 km/h, how long is it going to take for you to fly form Cape Town to New York? ___________________________________________
c) How far is it form Perth to Los Angeles? ______________________________
d) At what speed are you travelling if it takes you 12 hours to cover the distance at c? _________________________________________________________________
e) If you could walk at a speed of 8 km/h from Tokyo to London, then about how many days will it take you to complete the distance? __________________________
f) If you leave Cape Town at 20:18 and arrive in London the following morning at 09:05 (S.A. time), how long does your journey last?_________________________
g) What time will it be in England (March to September)?___________________
h) What time will it be in England (September to March)?___________________
i) Why does England adapt her time in this way? _________________________
_______________________________________________________________
j) Where else in the world is time also adapted in this way? ________________
Learning Outcome 4: The learner will be able to use appropriate measuring units, instruments and formulae in a variety of contexts.
Assessment Standard 4.1: We know this when the learner solves problems involving time, including relating time, distance and speed;
Learning Outcome 5: The learner will be able to collect, summarise, display and critically analyse data in order to draw conclusions and make predictions, and to interpret and determine chance variation.
Assessment Standard 5.5: We know this when the learner organises (including grouping where appropriate) and records data using tallies, tables and stem-and-leaf displays;
Assessment Standard 5.8: We know this when the learner draws a variety of graphs by hand/technology to display and interpret data (grouped and ungrouped);
Assessment Standard 5.9: We know this when the learner critically reads and interprets data presented in a variety of ways to draw conclusions and make predictions sensitive.

Notification Switch
Would you like to follow the 'Mathematics grade 7' conversation and receive update notifications?