| << Chapter < Page | Chapter >> Page > |
13. WAYS IN WHICH TO REPRESENT DATA
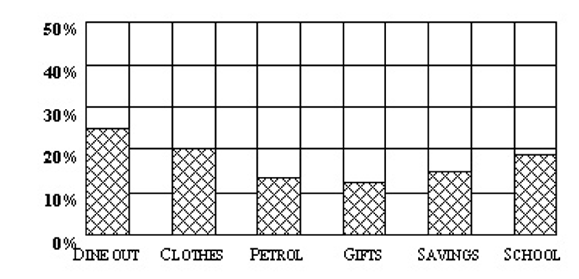
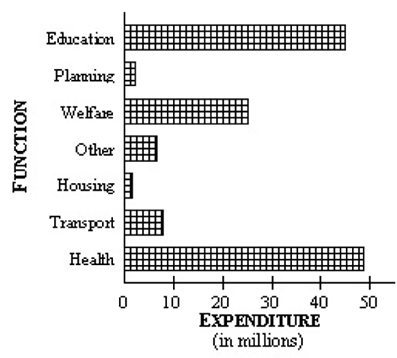
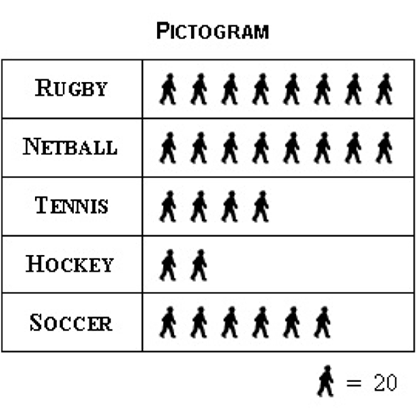
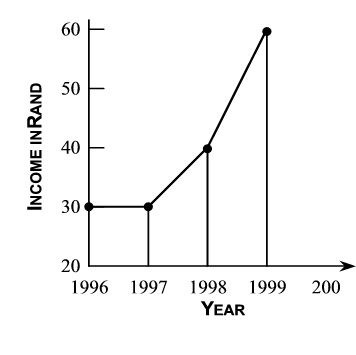
13.1 There are different ways in which data can be represented. Work through the following examples with a friend and make sure you understand each one.
COLUMN / BAR GRAPHS


PIE GRAPH
PICTOGRAM

LINE GRAPHS

13.2 CHALLENGE!
Work in groups of three. Page through your local newspaper and magazines. Cut out as many representations of data as possible. Group them and stick them neatly on cardboard. Hold an exhibition and discuss each group with the rest of the class.
13.3 Time for self-assessment
|
Uncertain | Certain |
| I can explain the concepts: | ||
|
||
|
||
|
||
|
||
|
||
| I can name at least two methods to organise information. | ||
| I can calculate the following correctly from given information: | ||
|
||
|
||
|
||
| I can name at least two methods to collect information. | ||
| I can explain what the following is and what it looks like: | ||
|
||
|
||
|
||
|
||
| I was able to correctly collect the information at question 12.3. | ||
| I was able to correctly collect the information at question 12.4. |
Learning Outcome 2: The learner will be able to recognise, describe and represent patterns and relationships, as well as to solve problems using algebraic language and skills.
Assessment Standard 2.6: We know this when the learner describes a situation by interpreting a graph of the situation, or draws a graph from a description of a situation (e.g. height of a roller-coaster car over time; the speed of a racing car going around a track).

Notification Switch
Would you like to follow the 'Mathematics grade 7' conversation and receive update notifications?