| << Chapter < Page | Chapter >> Page > |
Both the demand and supply curve show the relationship between price and the number of units demanded or supplied. Price elasticity is the ratio between the percentage change in the quantity demanded (Qd) or supplied (Qs) and the corresponding percent change in price. The price elasticity of demand is the percentage change in the quantity demanded of a good or service divided by the percentage change in the price. The price elasticity of supply is the percentage change in quantity supplied divided by the percentage change in price.
Elasticities can be usefully divided into three broad categories: elastic, inelastic, and unitary. An elastic demand or elastic supply is one in which the elasticity is greater than one, indicating a high responsiveness to changes in price. Elasticities that are less than one indicate low responsiveness to price changes and correspond to inelastic demand or inelastic supply . Unitary elasticities indicate proportional responsiveness of either demand or supply, as summarized in [link] .
| If . . . | Then . . . | And It Is Called . . . |
|---|---|---|
| Elastic | ||
| Unitary | ||
| Inelastic |
Before we get into the nitty gritty of elasticity, enjoy this article on elasticity and ticket prices at the Super Bowl.
To calculate elasticity, instead of using simple percentage changes in quantity and price, economists use the average percent change in both quantity and price. This is called the Midpoint Method for Elasticity, and is represented in the following equations:
The advantage of the is Midpoint Method is that one obtains the same elasticity between two price points whether there is a price increase or decrease. This is because the formula uses the same base for both cases.
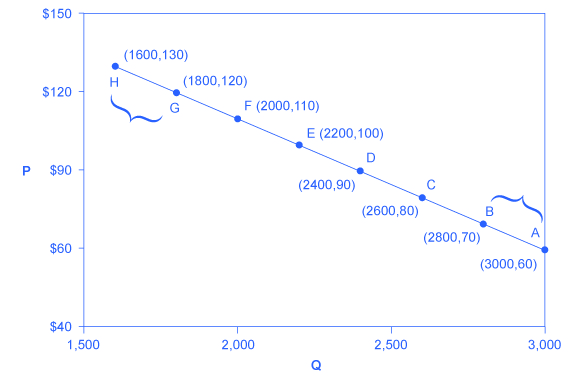
Let’s calculate the elasticity between points A and B and between points G and H shown in [link] .

First, apply the formula to calculate the elasticity as price decreases from $70 at point B to $60 at point A:
Therefore, the elasticity of demand between these two points is which is 0.45, an amount smaller than one, showing that the demand is inelastic in this interval. Price elasticities of demand are always negative since price and quantity demanded always move in opposite directions (on the demand curve). By convention, we always talk about elasticities as positive numbers. So mathematically, we take the absolute value of the result. We will ignore this detail from now on, while remembering to interpret elasticities as positive numbers.

Notification Switch
Would you like to follow the 'Openstax microeconomics in ten weeks' conversation and receive update notifications?