<< Chapter < Page Chapter >> Page >
Central Limit Theorem: Using the Central Limit Theorem is part of the collection col10555 written by Barbara Illowsky and Susan Dean. It covers how and when to use the Central Limit Theorem and has contributions from Roberta Bloom.

It is important for you to understand when to use the CLT . If you are being asked to find the probability of the mean, use the CLT for the mean. If youare being asked to find the probability of a sum or total, use the CLT for sums. This also applies to percentiles for means and sums.

If you are being asked to find the probability of an individual value, do not use the CLT. Use the distribution of its random variable.

Examples of the central limit theorem

Law of Large Numbers

The Law of Large Numbers says that if you take samples of larger and larger size from any population, then the mean x of the sample tends to get closer and closer to μ . From the Central Limit Theorem, we know that as n gets larger and larger, the sample means follow a normal distribution. The larger n gets, the smaller thestandard deviation gets. (Remember that the standard deviation for X is σ n .) This means that the sample mean x must be close to the population mean μ . We can say that μ is the value that the sample means approach as n gets larger. The Central Limit Theorem illustrates the Law of Large Numbers.

Central Limit Theorem for the Mean and Sum Examples

A study involving stress is done on a college campus among the students. The stress scores follow a uniform distribution with the lowest stress score equal to 1 and the highest equal to 5. Using a sample of 75 students, find:

  1. The probability that the mean stress score for the 75 students is less than 2.
  2. The 90th percentile for the mean stress score for the 75 students.
  3. The probability that the total of the 75 stress scores is less than 200.
  4. The 90th percentile for the total stress score for the 75 students.

Let X = one stress score.

Problems 1. and 2. ask you to find a probability or a percentile for a mean . Problems 3 and 4 ask you to find a probability or a percentile for a total or sum . The sample size, n , is equal to 75.

Since the individual stress scores follow a uniform distribution, X ~ U ( 1 , 5 ) where a = 1 and b = 5 (See Continuous Random Variables for the uniform).

μ X = a + b 2 = 1 + 5 2 = 3

σ X = ( b - a ) 2 12 = ( 5 - 1 ) 2 12 = 1.15

For problems 1. and 2., let X = the mean stress score for the 75 students. Then,

X ~ N ( 3 , 1.15 75 ) where n = 75 .

Find P ( x 2 ) . Draw the graph.

P ( x 2 ) = 0

The probability that the mean stress score is lessthan 2 is about 0.
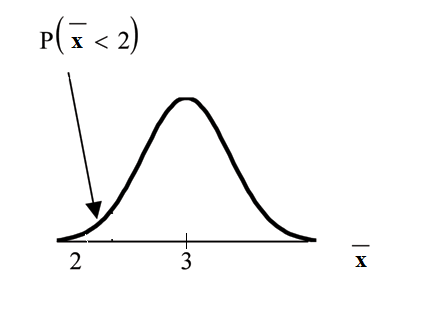
Normal distribution curve for the average with values of 2 and 3 on the x-axis. A vertical upward line extends from point 2 up to the curve. The probability area occurs from the beginning of the curve to point 2.

normalcdf ( 1 , 2 , 3 , 1.15 75 ) = 0

The smallest stress score is 1. Therefore, the smallest mean for 75 stress scores is 1.

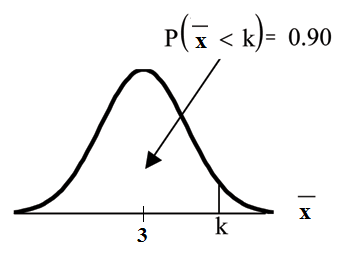
Find the 90th percentile for the mean of 75 stress scores. Draw a graph.

Let k = the 90th precentile.

Find k where P ( x k ) = 0.90 .

k = 3.2

Normal distribution curve graph with a vertical upward line at point k on the x-axis. The probability area under the curve before k is equal to 0.90. k is equal to the 90th percentile.

The 90th percentile for the mean of 75 scores is about 3.2. This tells us that 90% of all the means of 75 stress scores are at most 3.2 and 10% are at least3.2.

invNorm ( .90 , 3 , 1.15 75 ) = 3.2

For problems c and d, let ΣX = the sum of the 75 stress scores. Then, ΣX ~ N [ ( 75 ) ( 3 ) , 75 1.15 ]

Find P ( Σx 200 ) . Draw the graph.

The mean of the sum of 75 stress scores is 75 3 = 225

The standard deviation of thesum of 75 stress scores is 75 1.15 = 9.96
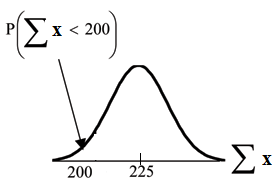
P ( Σx 200 ) = 0

Normal distribution curve of the sum x with values of 200 and 225 on the x-axis. A vertical upward line extends from point 200 to the curve. The probability area begins from the beginning of the curve to point 200.

The probability that the total of 75 scores is less than 200 is about 0.

normalcdf ( 75 , 200 , 75 3 , 75 1.15 ) = 0 .

The smallest total of 75 stress scores is 75 since the smallest single score is 1.

Questions & Answers

what is the anterior
Tito Reply
what is anatomy
Ruth Reply
To better understand how the different part of the body works. To understand the physiology of the various structures in the body. To differentiate the systems of the human body .
Roseann Reply
what is hypogelersomia
aliyu Reply
what are the parts of the female reproductive system?
Orji Reply
what is anatomy
Divinefavour Reply
what are the six types of synovial joints and their ligaments
Darlington Reply
draw the six types of synovial joint and their ligaments
Darlington
System of human beings
Katumi Reply
System in humans body
Katumi
Diagram of animals and plants cell
Favour Reply
at what age does development of bone end
Alal Reply
how many bones are in the human upper layers
Daniel Reply
how many bones do we have
Nbeke
bones that form the wrist
Priscilla Reply
yes because it is in the range of neutrophil count
Alexander Reply
because their basic work is to fight against harmful external bodies and they are always present when chematoxin are released in an area in body
Alexander
What is pathology
Samuel Reply
what is pathology
Nbeke
what's pathology
Nbeke
what is anatomy
ESTHER Reply
Got questions? Join the online conversation and get instant answers!
Jobilize.com Reply
Practice Key Terms 5

Get Jobilize Job Search Mobile App in your pocket Now!

Get it on Google Play Download on the App Store Now


Source:  OpenStax, Principles of business statistics. OpenStax CNX. Aug 05, 2009 Download for free at http://cnx.org/content/col10874/1.5
Google Play and the Google Play logo are trademarks of Google Inc.

Notification Switch

Would you like to follow the 'Principles of business statistics' conversation and receive update notifications?

Ask