-
Home
- Collaborative statistics (custom
- Probability topics
- Venn diagrams
This module introduces Venn diagrams as a method for solving some probability problems. This module is included in the Elementary Statistics textbook/collection as an optional lesson.
A
Venn diagram is a picture that represents the outcomes of an experiment. It generally consists of a box that represents the sample space S together with circles or ovals. The circles or ovals represent events.
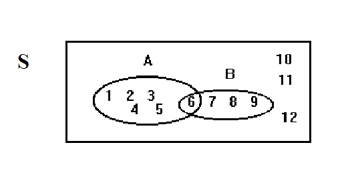
Suppose an experiment has the outcomes 1, 2, 3, ... , 12 where each outcome has an equal chance of occurring. Let event
and event
. Then
and
. The Venn diagram is as follows:

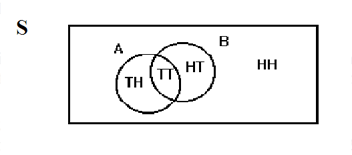
Flip 2 fair coins. Let
= tails on the first coin. Let
= tails on the second coin. Then
and
.
Therefore,
.
.
The sample space when you flip two fair coins is
. The outcome
is in neither
nor
. The Venn diagram is as follows:

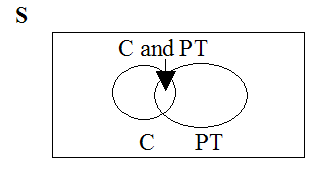
Forty percent of the students at a local college belong to a club and
50% work part time.
Five percent of the students work part time and belong to a club. Draw a Venn diagram showing the relationships. Let
= student belongs to a club and
= student works part time.

If a student is selected at random find
Questions & Answers
what is defense mechanism
what is defense mechanisms
Chinaza
I'm interested in biological psychology and cognitive psychology
what does preconceived mean
How can I develope my cognitive domain
why is communication effective
Communication is effective because it allows individuals to share ideas, thoughts, and information with others.
effective communication can lead to improved outcomes in various settings, including personal relationships, business environments, and educational settings. By communicating effectively, individuals can negotiate effectively, solve problems collaboratively, and work towards common goals.
it starts up serve and return practice/assessments.it helps find voice talking therapy also assessments through relaxed conversation.
miss
Every time someone flushes a toilet in the apartment building, the person begins to jumb back automatically after hearing the flush, before the water temperature changes. Identify the types of learning, if it is classical conditioning identify the NS, UCS, CS and CR. If it is operant conditioning, identify the type of consequence positive reinforcement, negative reinforcement or punishment
please i need answer
Wekolamo
because it helps many people around the world to understand how to interact with other people and understand them well, for example at work (job).
Agreed 👍 There are many parts of our brains and behaviors, we really need to get to know. Blessings for everyone and happy Sunday!
ARC
A child is a member of community not society elucidate ?
Isn't practices worldwide, be it psychology, be it science. isn't much just a false belief of control over something the mind cannot truly comprehend?
compare and contrast skinner's perspective on personality development on freud
Skinner skipped the whole unconscious phenomenon and rather emphasized on classical conditioning
war
explain how nature and nurture affect the development and later the productivity of an individual.
nature is an hereditary factor while nurture is an environmental factor which constitute an individual personality. so if an individual's parent has a deviant behavior and was also brought up in an deviant environment, observation of the behavior and the inborn trait we make the individual deviant.
Samuel
I am taking this course because I am hoping that I could somehow learn more about my chosen field of interest and due to the fact that being a PsyD really ignites my passion as an individual the more I hope to learn about developing and literally explore the complexity of my critical thinking skills
and having a good philosophy of the world is like a sandwich and a peanut butter 👍
Jonathan
generally amnesi how long yrs memory loss
interpersonal relationships
Got questions? Join the online conversation and get instant answers!
Source:
OpenStax, Collaborative statistics (custom lecture version modified by t. short). OpenStax CNX. Jul 15, 2013 Download for free at http://cnx.org/content/col11543/1.1
Google Play and the Google Play logo are trademarks of Google Inc.


