| << Chapter < Page | Chapter >> Page > |
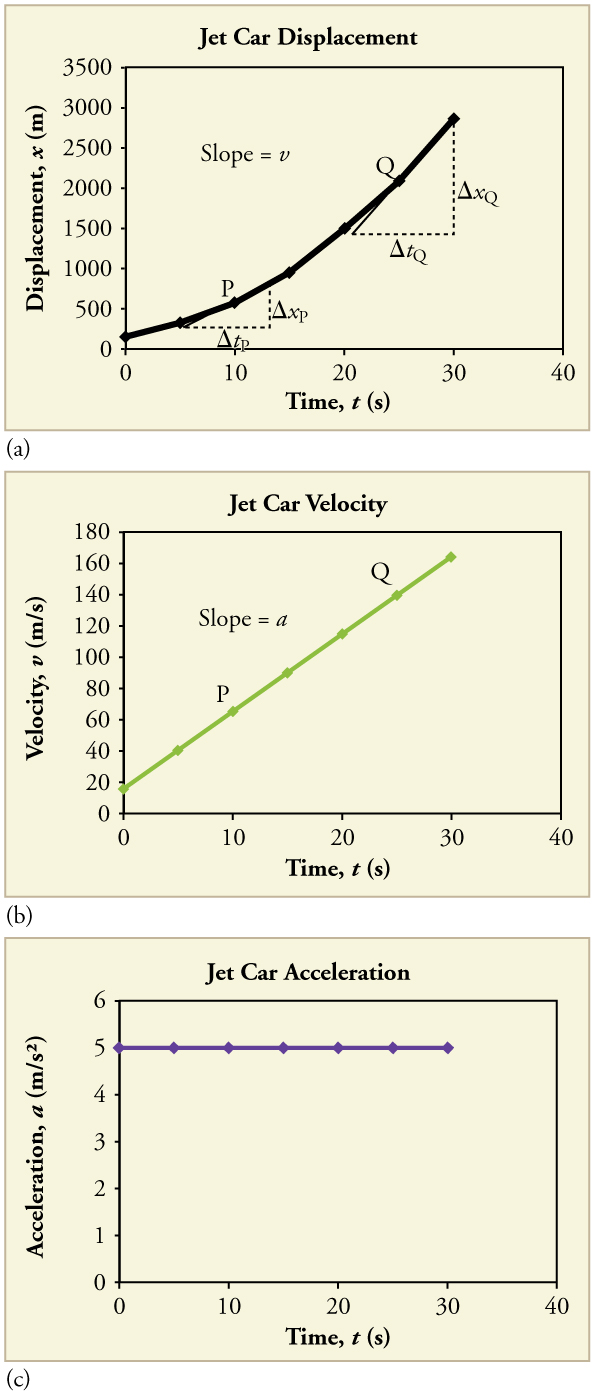
The graphs in [link] below represent the motion of the jet-powered car as it accelerates toward its top speed, but only during the time when its acceleration is constant. Time starts at zero for this motion (as if measured with a stopwatch), and the displacement and velocity are initially 200 m and 15 m/s, respectively.


The graph of displacement versus time in [link] (a) is a curve rather than a straight line. The slope of the curve becomes steeper as time progresses, showing that the velocity is increasing over time. The slope at any point on a displacement-versus-time graph is the instantaneous velocity at that point. It is found by drawing a straight line tangent to the curve at the point of interest and taking the slope of this straight line. Tangent lines are shown for two points in [link] (a). If this is done at every point on the curve and the values are plotted against time, then the graph of velocity versus time shown in [link] (b) is obtained. Furthermore, the slope of the graph of velocity versus time is acceleration, which is shown in [link] (c).
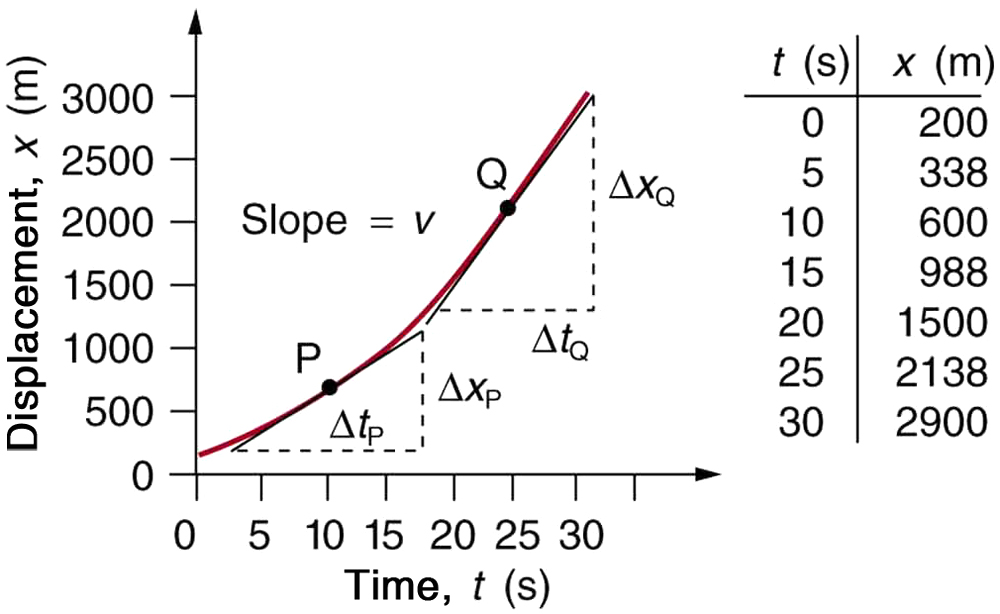
Calculate the velocity of the jet car at a time of 25 s by finding the slope of the vs. graph in the graph below.

Strategy
The slope of a curve at a point is equal to the slope of a straight line tangent to the curve at that point. This principle is illustrated in [link] , where Q is the point at .
Solution
1. Find the tangent line to the curve at .
2. Determine the endpoints of the tangent. These correspond to a position of 1300 m at time 19 s and a position of 3120 m at time 32 s.
3. Plug these endpoints into the equation to solve for the slope, .
Thus,
Discussion
This is the value given in this figure’s table for at . The value of 140 m/s for is plotted in [link] . The entire graph of vs. can be obtained in this fashion.
Carrying this one step further, we note that the slope of a velocity versus time graph is acceleration. Slope is rise divided by run; on a vs. graph, rise = change in velocity and run = change in time .
The slope of a graph of velocity vs. time is acceleration .
Since the velocity versus time graph in [link] (b) is a straight line, its slope is the same everywhere, implying that acceleration is constant. Acceleration versus time is graphed in [link] (c).

Notification Switch
Would you like to follow the 'Une: physics for the health professions' conversation and receive update notifications?