| << Chapter < Page | Chapter >> Page > |

In 2010 CCAP put out a progress report wherein progress is measured by the many small steps that are being taken to implement the plan. It is not translated exactly to emissions reductions but reports on progress for each step such as the number of residential units that have been retrofitted for energy efficiency, the number of appliances traded in, the increase in the number of rides on public transit, and the amount of water conserved daily.
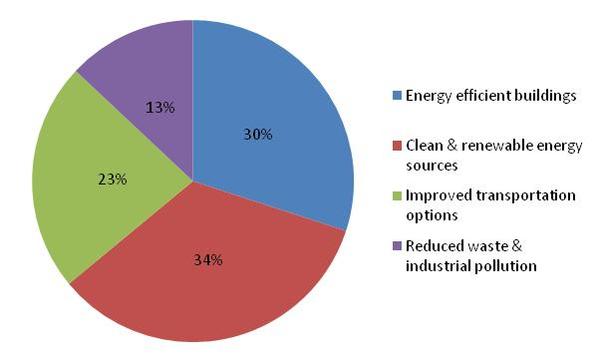
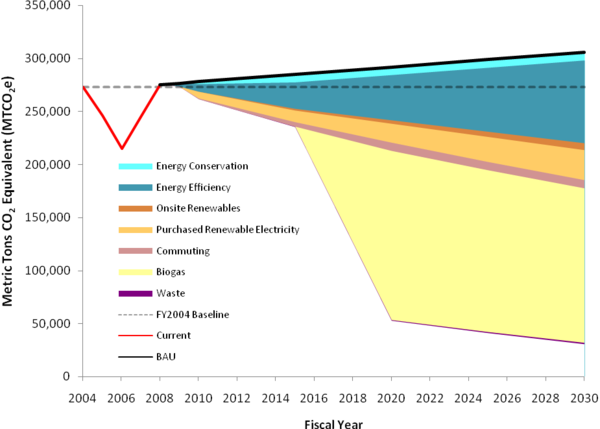
Several factors caused a major Chicago university to develop a climate action plan. As part of the American College and University Presidents’ Climate Commitment (ACUPCC), nearly 670 presidents have signed a commitment to inventory their greenhouse gases, publicly report it, and to develop a climate action plan. Part of the Chicago CAP is to engage businesses and organizations within the city in climate action planning. In order to be a better steward of the environment, the University of Illinois at Chicago (UIC) developed a climate action plan . The goals are similar to Chicago’s: a 40 percent GHG emissions reduction by 2030 and at least 80 percent by 2050, using a 2004 baseline. The strategies align with those of the city in which the campus resides (see Table Alignment of the Chicago and UIC Climate Action Plans ). UIC’s greenhouse gas reports are also made publically available on the ACUPCC reporting site . Figure UIC’s Projected Emissions Reductions displays UIC’s calculated emissions inventory (in red) and then the predicted increases for growth if activities continue in a “business as usual (BAU)” approach. The triangular wedges below represent emissions reductions through a variety of strategies, similar to those of the wedge approach that Professors Sokolow and Pacala proposed. Those strategies are displayed in Table Alignment of the Chicago and UIC Climate Action Plans , alongside Chicago’s for comparative purposes.

The UIC CAP also has major strategy categories that are similar to Chicago’s and within each strategy there are a number of recommended actions. Progress on this plan will be monitored both by reporting emissions at least every two years to the ACUPCC and by tracking individual actions and reporting to the campus community.
| CHICAGO CAP | UIC CAP |
| Energy Efficient Buildings | Energy Efficiency and Conservation |
| Retrofit commercial and industrial buildings | Retrofit buildings |
| Retrofit residential buildings | Energy performance contracting |
| Trade in appliances | Monitoring and maintenance |
| Conserve water | Water conservation |
| Update City energy code | Establish green building standards |
| Establish new guidelines for renovations | |
| Cool with trees and green roofs | Green roofs/reflective roofs |
| Take easy steps | Energy conservation by campus community |
| Clean&Renewable Energy Sources | Clean and Renewable Energy |
| Upgrade power plants | Modify power plants |
| Improve power plant efficiency | Purchase electricity from a renewable electricity provider |
| Build renewable electricity | Build renewable electricity |
| Increase distributed generation | |
| Promote household renewable power | Geothermal heating and cooling |
| Improved Transportation Options | Improved Transportation Options |
| Invest more in transit | |
| Expand transit incentives | Expand transit incentives |
| Promote transit-oriented development | |
| Make walking and biking easier | Make walking and biking easier |
| Car share and car pool | Car sharing/car pool program |
| Improve fleet efficiency | Continue to improve fleet efficiency |
| Achieve higher fuel efficiency standards | |
| Switch to cleaner fuels | |
| Support intercity rail | Reduce business travel (web conferencing) |
| Improve freight movement | Anti-Idling regulations/guidelines |
| Reduced Waste&Industrial Pollution | Recycling and Waste Management |
| Reduce, reuse and recycle | Establishing recycling goals |
| Shift to alternative refrigerants | Composting |
| Capture stormwater on site | Sustainable food purchases&use of biodegradable packaging |
| Collecting and converting vegetable oil | |
| Develop a user-friendly property management system | |
| Expand the waste minimization program | |
| Recycle construction debris | |
| Purchasing policies | |
| Preparation (Adaptation) | Improved Grounds Operations |
| Manage heat | Capture stormwater on site |
| Protect air quality | Use native species |
| Manage stormwater | Reduce/eliminate irrigation |
| Implement green urban design | Integrated pest management |
| Preserve plants and trees | Tree care plan |
| Pursue innovative cooling | |
| Engage the public | Education, Research and Public Engagement |
| Engage businesses | Employment Strategies |
| Plan for the future | Telecommuting |
| Flextime | |
| Childcare center | |
| Public Engagement |
There is no one approach that will effectively reduce greenhouse gas emissions. Climate action plans are helpful tools to represent strategies to reduce emissions. Governmental entities such as nations, states, and cities can develop plans, as can institutions and businesses. It is important that there be an alignment of plans when they intersect, such as a city and a university that resides within it.

Notification Switch
Would you like to follow the 'Physics 105: adventures in physics' conversation and receive update notifications?