<< Chapter < Page Chapter >> Page >

Antarctic ice cores are a key example of such evidence. These ice cores are samples of polar ice obtained by means of drills that reach thousands of meters into ice sheets or high mountain glaciers. Viewing the ice cores is like traveling backwards through time; the deeper the sample, the earlier the time period. Trapped within the ice are bubbles of air and other biological evidence that can reveal temperature and carbon dioxide data. Antarctic ice cores have been collected and analyzed to indirectly estimate the temperature of the Earth over the past 400,000 years ( [link] a ). The 0 °C on this graph refers to the long-term average. Temperatures that are greater than 0 °C exceed Earth’s long-term average temperature. Conversely, temperatures that are less than 0 °C are less than Earth’s average temperature. This figure shows that there have been periodic cycles of increasing and decreasing temperature.

Before the late 1800s, the Earth has been as much as 9 °C cooler and about 3 °C warmer. Note that the graph in [link] b shows that the atmospheric concentration of carbon dioxide has also risen and fallen in periodic cycles; note the relationship between carbon dioxide concentration and temperature. [link] b shows that carbon dioxide levels in the atmosphere have historically cycled between 180 and 300 parts per million (ppm) by volume.
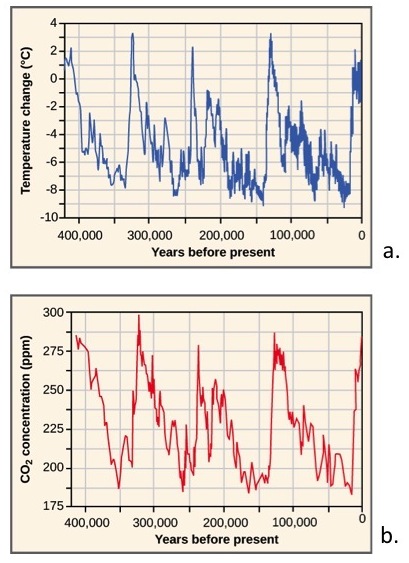
 Top graph plots temperature in degrees Celsius versus years before present, beginning 400,000 years ago. Temperature shows a cyclical variation, from about 2 degrees Celsius above today’s average temperature, to about 8 degrees below. Carbon dioxide levels also show a cyclical variation. Today, the carbon dioxide concentration is about 395 parts per million. In the past, it cycled between 180 and 300 parts per million. The temperature and carbon dioxide cycles, which repeat at about a hundred thousand year scale, closely mirror one another.
Ice at the Russian Vostok station in East Antarctica was laid down over the course 420,000 years and reached a depth of over 3,000 m. By measuring the amount of CO 2 trapped in the ice, scientists have determined past atmospheric CO 2 concentrations. Temperatures relative to modern day were determined from the amount of deuterium (an isotope of hydrogen) present.

[link] a does not show the last 2,000 years with enough detail to compare the changes of Earth’s temperature during the last 400,000 years with the temperature change that has occurred in the more recent past. Two significant temperature anomalies, or irregularities, have occurred in the last 2000 years. These are the Medieval Climate Anomaly (or the Medieval Warm Period) and the Little Ice Age. A third temperature anomaly aligns with the Industrial Era. The Medieval Climate Anomaly occurred between 900 and 1300 AD. During this time period, many climate scientists think that slightly warmer weather conditions prevailed in many parts of the world; the higher-than-average temperature changes varied between 0.10 °C and 0.20 °C above the norm. Although 0.10 °C does not seem large enough to produce any noticeable change, it did free seas of ice. Because of this warming, the Vikings were able to colonize Greenland.

The Little Ice Age was a cold period that occurred between 1550 AD and 1850 AD. During this time, a slight cooling of a little less than 1 °C was observed in North America, Europe, and possibly other areas of the Earth. This 1 °C change in global temperature is a seemingly small deviation in temperature (as was observed during the Medieval Climate Anomaly); however, it also resulted in noticeable changes. Historical accounts reveal a time of exceptionally harsh winters with much snow and frost.

Questions & Answers

A golfer on a fairway is 70 m away from the green, which sits below the level of the fairway by 20 m. If the golfer hits the ball at an angle of 40° with an initial speed of 20 m/s, how close to the green does she come?
Aislinn Reply
cm
tijani
what is titration
John Reply
what is physics
Siyaka Reply
A mouse of mass 200 g falls 100 m down a vertical mine shaft and lands at the bottom with a speed of 8.0 m/s. During its fall, how much work is done on the mouse by air resistance
Jude Reply
Can you compute that for me. Ty
Jude
what is the dimension formula of energy?
David Reply
what is viscosity?
David
what is inorganic
emma Reply
what is chemistry
Youesf Reply
what is inorganic
emma
Chemistry is a branch of science that deals with the study of matter,it composition,it structure and the changes it undergoes
Adjei
please, I'm a physics student and I need help in physics
Adjanou
chemistry could also be understood like the sexual attraction/repulsion of the male and female elements. the reaction varies depending on the energy differences of each given gender. + masculine -female.
Pedro
A ball is thrown straight up.it passes a 2.0m high window 7.50 m off the ground on it path up and takes 1.30 s to go past the window.what was the ball initial velocity
Krampah Reply
2. A sled plus passenger with total mass 50 kg is pulled 20 m across the snow (0.20) at constant velocity by a force directed 25° above the horizontal. Calculate (a) the work of the applied force, (b) the work of friction, and (c) the total work.
Sahid Reply
you have been hired as an espert witness in a court case involving an automobile accident. the accident involved car A of mass 1500kg which crashed into stationary car B of mass 1100kg. the driver of car A applied his brakes 15 m before he skidded and crashed into car B. after the collision, car A s
Samuel Reply
can someone explain to me, an ignorant high school student, why the trend of the graph doesn't follow the fact that the higher frequency a sound wave is, the more power it is, hence, making me think the phons output would follow this general trend?
Joseph Reply
Nevermind i just realied that the graph is the phons output for a person with normal hearing and not just the phons output of the sound waves power, I should read the entire thing next time
Joseph
Follow up question, does anyone know where I can find a graph that accuretly depicts the actual relative "power" output of sound over its frequency instead of just humans hearing
Joseph
"Generation of electrical energy from sound energy | IEEE Conference Publication | IEEE Xplore" ***ieeexplore.ieee.org/document/7150687?reload=true
Ryan
what's motion
Maurice Reply
what are the types of wave
Maurice
answer
Magreth
progressive wave
Magreth
hello friend how are you
Muhammad Reply
fine, how about you?
Mohammed
hi
Mujahid
A string is 3.00 m long with a mass of 5.00 g. The string is held taut with a tension of 500.00 N applied to the string. A pulse is sent down the string. How long does it take the pulse to travel the 3.00 m of the string?
yasuo Reply
Who can show me the full solution in this problem?
Reofrir Reply
Got questions? Join the online conversation and get instant answers!
Jobilize.com Reply

Get Jobilize Job Search Mobile App in your pocket Now!

Get it on Google Play Download on the App Store Now


Source:  OpenStax, Principles of biology. OpenStax CNX. Aug 09, 2016 Download for free at http://legacy.cnx.org/content/col11569/1.25
Google Play and the Google Play logo are trademarks of Google Inc.

Notification Switch

Would you like to follow the 'Principles of biology' conversation and receive update notifications?

Ask