| << Chapter < Page | Chapter >> Page > |
12. If the application is being executed inside a function in response to a function call, it is possible to force the return of this function through the command Run>Step Return (F7). The debugger will execute the rest of the function code and return the calling point. The execution will be suspended at this point;
13. The command Terminate allows finishing of the application’s debugging.
All the MSP430 family of devices have an advanced code debugging module (EEM - Enhanced Emulation Module). This module allows CCE to monitor the device’s operation in a non-intrusive way, and without using any resources. Thus, it facilitates the development of the application through the verification of its operation. Depending on the device, the EEM module implementations differ. Generally, the following features are present:
- Up to 8 hardware breakpoints;
- Operates in all range of frequencies and clock sources;
- Ability to set more complex breakpoints through association of triggers;
- Suspend the execution of the application on the occurrence of a program or data bus access;
- Access protection to protected data and program memory areas;
- All timers and counters can be inhibited (depending on the device);
- Inhibits PWM signals generation on the occurrence of the application’s suspension;
- Allows real-time execution of the applications in the modes: single step, step into; run to cursor; step over;
- Supports all low power modes.
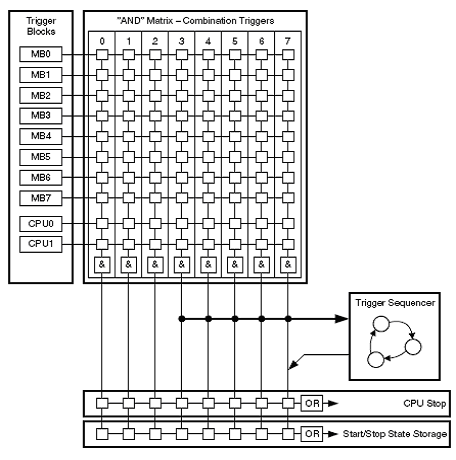
The Figure 1 represents a simplified block diagram of one of the most complete implementations of EEM module.
Cce workbench – eem module block diagram.

Events within the device can generate triggers. These triggers can be classified as the event that causes them to:
- Access to addressing and data buses;
- Access to CPU registers.
Depending on the device, it is possible to associate two or more of these triggers, in order to build complex event detectors that help the detection of incorrect operation of applications. Generally, a trigger can be used to control the following functional blocks of the EEM: breakpoints, trace, and sequencer. The activation of a trigger is conditioned to an access to the data and program busses or access to CPU registers.
A breakpoint is set through one or more triggers. Through these it is possible to establish the following types of breakpoints:
- Address breakpoint;
- Data breakpoint;
- Register Breakpoint;
- Mask Register;
- Range breakpoint.
A simple breakpoint is defined using a trigger associated with an instruction read operation by the CPU. It is necessary to specify the instruction address where the trigger should occur.
By combining two triggers, it is possible to establish a Data Breakpoint. While one of the triggers is used to detect the occurrence of a particular address on the address bus, the other is used to detect the occurrence of a read or write operation at that address. It is possible to force the suspension of the execution of the application to only occur when there is a match between the value written or read and the one specified.

Notification Switch
Would you like to follow the 'Teaching and classroom laboratories based on the “ez430” and "experimenter's board" msp430 microcontroller platforms and code composer essentials' conversation and receive update notifications?