| << Chapter < Page | Chapter >> Page > |
The value “ r” can be positive, meaning the population is increasing in size; or negative, meaning the population is decreasing in size; or zero, where the population’s size is unchanging, a condition known as zero population growth . A further refinement of the formula recognizes that different species have inherent differences in their intrinsic rate of increase (often thought of as the potential for reproduction), even under ideal conditions. Obviously, a bacterium can reproduce more rapidly and have a higher intrinsic rate of growth than a human. The maximal growth rate for a species is its biotic potential, or r max .
Population growth (G) is the number of individuals that are added to a population in a given period of time. It can be determined using growth rate (r):
Take the example of a population of 1,000 rats, and this population has 150 births every month, along with 50 deaths each month. To predict how quickly this population would grow over the course of several months, the following calculations would be performed:
Birth rate takes into account the number of births that occur in a given month,
Death rate takes into account the number of births that occur in a given month,
Growth rate takes into account both the births and deaths that occur, giving us an overall rate of growth for the population,
And population growth is the number of individuals added to the population in a given month.
Simply put, the above calculations tell us that in one month, 100 rats were added into the original population of 1,000. To predict the next month's growth apply the population growth calculation again, using the new population size of 1,100. This method of prediction does make a couple of assumptions, however. First, migration patterns are not taken into account. Movement in and out of a population can have significant effects on actual population size. And second, this assumes a constant growth rate throughout time. Growth rate is rarely constant, because the environment is rarely unchanging. Birth and death rates can be significantly affected by random events that happen in the environment, affecting these rates.
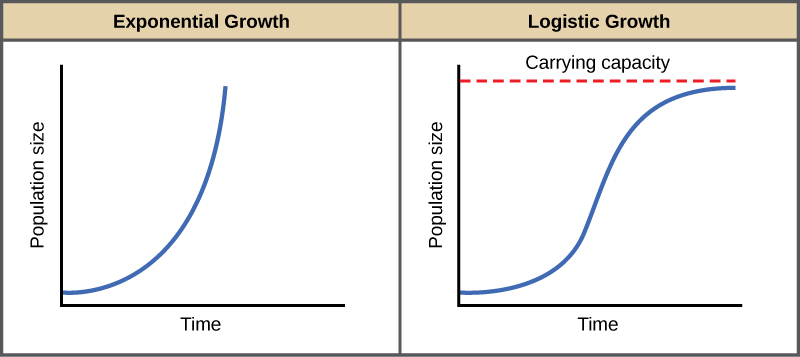
In ( [link] ) below, the graph on the left indicates the type of growth pattern when growth rate is constant and there are no limits placed on how fast a population can grow, such as with the rat population from the previous example. The graph on the left however, is a more accurate depiction of how population growth occurs in a natural setting where resources are limiting, and competition for resources almost always exist. This type of growth is called logistic growth.


Notification Switch
Would you like to follow the 'Bi 101 for lbcc ilearn campus' conversation and receive update notifications?