| << Chapter < Page | Chapter >> Page > |
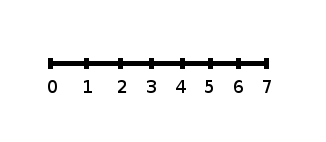
The number line may help you understand standard deviation. If we were to put 5 and 7 on a number line, 7 is to the right of 5. We say, then, that 7 is
one standard deviation to the
right of 5 because
.
If 1 were also part of the data set, then 1 is
two standard deviations to the
left of 5 because
.

The equation value = mean + (#ofSTDEVs)(standard deviation) can be expressed for a sample and for a population:
The procedure to calculate the standard deviation depends on whether the numbers are the entire population or are data from a sample. The calculations are similar, but not identical. Therefore the symbol used to represent the standard deviation depends on whether it is calculated from a population or a sample. The lower case letter represents the sample standard deviation and the Greek letter (sigma, lower case) represents the population standard deviation. If the sample has the same characteristics as the population, then should be a good estimate of .
To calculate the standard deviation, we need to calculate the variance first. The variance is an average of the squares of the deviations (the values for a sample, or the values for a population). The symbol represents the population variance; the population standard deviation is the square root of the population variance. The symbol represents the sample variance; the sample standard deviation is the square root of the sample variance. You can think of the standard deviation as a special average of the deviations.
If the numbers come from a census of the entire population and not a sample, when we calculate the average of the squared deviations to find the variance, we divide by N , the number of items in the population. If the data are from a sample rather than a population, when we calculate the average of the squared deviations, we divide by n-1 , one less than the number of items in the sample. You can see that in the formulas below.

Notification Switch
Would you like to follow the 'Collaborative statistics (custom online version modified by t. short)' conversation and receive update notifications?