| << Chapter < Page | Chapter >> Page > |
In the early twentieth century, English mathematician Godfrey Hardy and German physician Wilhelm Weinberg stated the principle of equilibrium to describe the genetic makeup of a population. The theory, which later became known as the Hardy-Weinberg principle of equilibrium, states that a population’s allele and genotype frequencies are inherently stable— unless some kind of evolutionary force is acting upon the population, neither the allele nor the genotypic frequencies would change. The Hardy-Weinberg principle assumes conditions with no mutations, migration, emigration, or selective pressure for or against genotype, plus an infinite population; while no population can satisfy those conditions, the principle offers a useful model against which to compare real population changes.
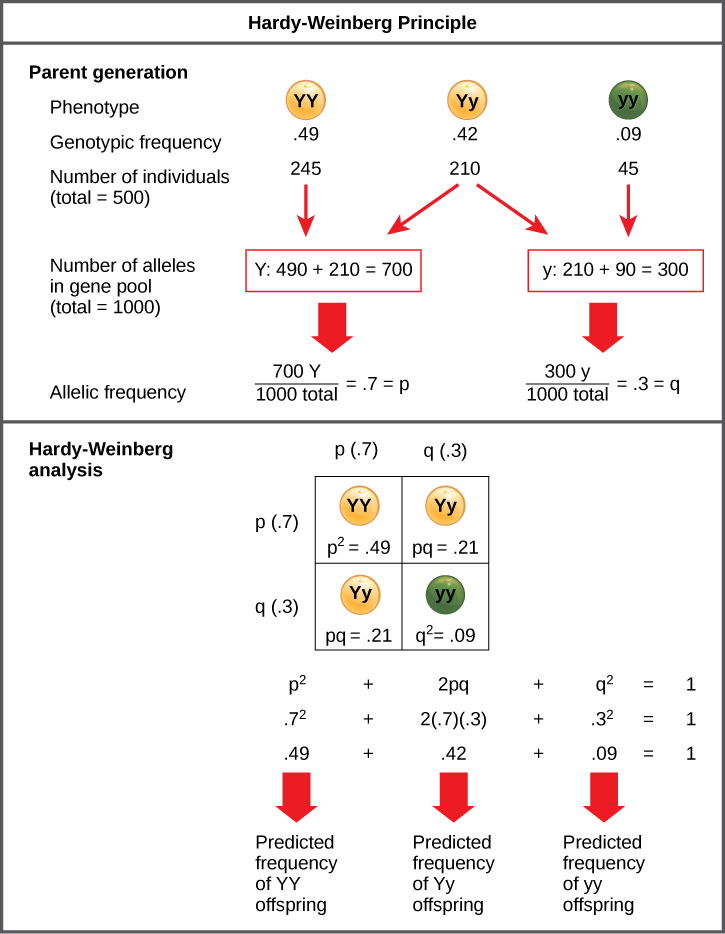
Working under this theory, population geneticists represent different alleles as different variables in their mathematical models. The variable p, for example, often represents the frequency of a particular allele, say Y for the trait of yellow in Mendel’s peas, while the variable q represents the frequency of y alleles that confer the color green. If these are the only two possible alleles for a given locus in the population, p + q = 1. In other words, all the p alleles and all the q alleles make up all of the alleles for that locus that are found in the population.
But what ultimately interests most biologists is not the frequencies of different alleles, but the frequencies of the resulting genotypes, known as the population’s genetic structure , from which scientists can surmise the distribution of phenotypes. If the phenotype is observed, only the genotype of the homozygous recessive alleles can be known; the calculations provide an estimate of the remaining genotypes. Since each individual carries two alleles per gene, if the allele frequencies (p and q) are known, predicting the frequencies of these genotypes is a simple mathematical calculation to determine the probability of getting these genotypes if two alleles are drawn at random from the gene pool. So in the above scenario, an individual pea plant could be pp (YY), and thus produce yellow peas; pq (Yy), also yellow; or qq (yy), and thus producing green peas ( [link] ). In other words, the frequency of pp individuals is simply p 2 ; the frequency of pq individuals is 2pq; and the frequency of qq individuals is q 2 . And, again, if p and q are the only two possible alleles for a given trait in the population, these genotypes frequencies will sum to one: p 2 + 2pq + q 2 = 1.

In plants, violet flower color (V) is dominant over white (v). If p = 0.8 and q = 0.2 in a population of 500 plants, how many individuals would you expect to be homozygous dominant (VV), heterozygous (Vv), and homozygous recessive (vv)? How many plants would you expect to have violet flowers, and how many would have white flowers?
In theory, if a population is at equilibrium—that is, there are no evolutionary forces acting upon it—generation after generation would have the same gene pool and genetic structure, and these equations would all hold true all of the time. Of course, even Hardy and Weinberg recognized that no natural population is immune to evolution. Populations in nature are constantly changing in genetic makeup due to drift, mutation, possibly migration, and selection. As a result, the only way to determine the exact distribution of phenotypes in a population is to go out and count them. But the Hardy-Weinberg principle gives scientists a mathematical baseline of a non-evolving population to which they can compare evolving populations and thereby infer what evolutionary forces might be at play. If the frequencies of alleles or genotypes deviate from the value expected from the Hardy-Weinberg equation, then the population is evolving.
Use this online calculator to determine the genetic structure of a population.
The modern synthesis of evolutionary theory grew out of the cohesion of Darwin’s, Wallace’s, and Mendel’s thoughts on evolution and heredity, along with the more modern study of population genetics. It describes the evolution of populations and species, from small-scale changes among individuals to large-scale changes over paleontological time periods. To understand how organisms evolve, scientists can track populations’ allele frequencies over time. If they differ from generation to generation, scientists can conclude that the population is not in Hardy-Weinberg equilibrium, and is thus evolving.
[link] In plants, violet flower color (V) is dominant over white (v). If p=.8 and q = 0.2 in a population of 500 plants, how many individuals would you expect to be homozygous dominant (VV), heterozygous (Vv), and homozygous recessive (vv)? How many plants would you expect to have violet flowers, and how many would have white flowers?
[link] The expected distribution is 320 VV, 160Vv, and 20 vv plants. Plants with VV or Vv genotypes would have violet flowers, and plants with the vv genotype would have white flowers, so a total of 480 plants would be expected to have violet flowers, and 20 plants would have white flowers.

Notification Switch
Would you like to follow the 'Ebio 124: introduction to ecology & Evolutionary biology' conversation and receive update notifications?