| << Chapter < Page | Chapter >> Page > |

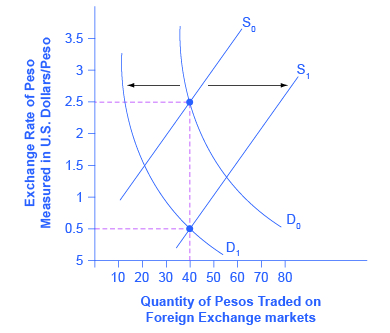
If a country experiences a relatively high inflation rate compared with other economies, then the buying power of its currency is eroding, which will tend to discourage anyone from wanting to acquire or to hold the currency. [link] shows an example based on an actual episode concerning the Mexican peso. In 1986–87, Mexico experienced an inflation rate of over 200%. Not surprisingly, as inflation dramatically decreased the purchasing power of the peso in Mexico, the exchange rate value of the peso declined as well. As shown in [link] , demand for the peso on foreign exchange markets decreased from D 0 to D 1 , while supply of the peso increased from S 0 to S 1 . The equilibrium exchange rate fell from $2.50 per peso at the original equilibrium (E 0 ) to $0.50 per peso at the new equilibrium (E 1 ). In this example, the quantity of pesos traded on foreign exchange markets remained the same, even as the exchange rate shifted.

Visit this website to learn about the Big Mac index.
Over the long term, exchange rates must bear some relationship to the buying power of the currency in terms of goods that are internationally traded. If at a certain exchange rate it was much cheaper to buy internationally traded goods—such as oil, steel, computers, and cars—in one country than in another country, businesses would start buying in the cheap country, selling in other countries, and pocketing the profits.
For example, if a U.S. dollar is worth $1.60 in Canadian currency, then a car that sells for $20,000 in the United States should sell for $32,000 in Canada. If the price of cars in Canada was much lower than $32,000, then at least some U.S. car-buyers would convert their U.S. dollars to Canadian dollars and buy their cars in Canada. If the price of cars was much higher than $32,000 in this example, then at least some Canadian buyers would convert their Canadian dollars to U.S. dollars and go to the United States to purchase their cars. This is known as arbitrage , the process of buying and selling goods or currencies across international borders at a profit. It may occur slowly, but over time, it will force prices and exchange rates to align so that the price of internationally traded goods is similar in all countries.

Notification Switch
Would you like to follow the 'Principles of macroeconomics' conversation and receive update notifications?