| << Chapter < Page | Chapter >> Page > |
If you want to find the probability that the mean of 50 customers is less than $60, the distribution to use is:
B:
The next three questions refer to the following situation:
The amount of time it takes a fourth grader to carry out the trash is uniformly distributed in the interval from 1 to 10 minutes.
What is the probability that a randomly chosen fourth grader takes more than 7 minutes to take out the trash?
A:
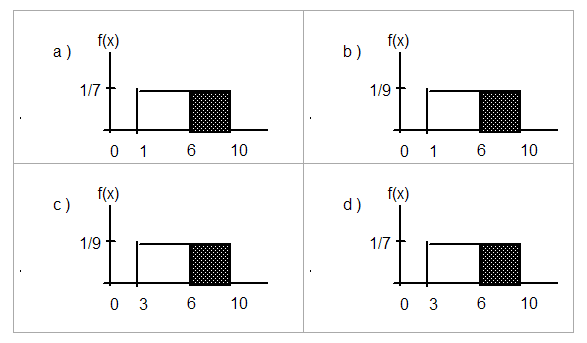
Which graph best shows the probability that a randomly chosen fourth grader takes more than 6 minutes to take out the trash given that he/she has already taken more than 3 minutes?

D
We should expect a fourth grader to take how many minutes to take out the trash?
B: 5.5
The next three questions refer to the following situation:
At the beginning of the quarter, the amount of time a student waits in line at the campus cafeteria is normally distributed with a mean of 5 minutes and a standard deviation of 1.5 minutes.
What is the 90th percentile of waiting times (in minutes)?
D: 6.92
The median waiting time (in minutes) for one student is:
A: 5
Find the probability that the average wait time of 10 students is at most 5.5 minutes.
B: 0.8541
A sample of 80 software engineers in Silicon Valley is taken and it is found that 20% of them earn approximately $50,000 per year. A point estimate for the true proportion of engineers in Silicon Valley who earn $50,000 per year is:
B: 0.2
If . 1587 where ~ , then is equal to:
A: -1
A professor tested 35 students to determine their entering skills. At the end of the term, after completing the course, the same test was administered to the same 35 students to study their improvement. This would be a test of:
C: matched pairs, dependent groups
A math exam was given to all the third grade children attending ABC School. Two random samples of scores were taken.
| n | s | ||
|---|---|---|---|
| Boys | 55 | 82 | 5 |
| Girls | 60 | 86 | 7 |
Which of the following correctly describes the results of a hypothesis test of the claim, “There is a difference between the mean scores obtained by third grade girls and boys at the 5 % level of significance”?
D: Reject . There is sufficient evidence to conclude that there is a difference in the mean scores.
In a survey of 80 males, 45 had played an organized sport growing up. Of the 70 females surveyed, 25 had played an organized sport growing up. We are interested in whether the proportion for males is higher than the proportion for females. The correct conclusion is:
C: There is sufficient evidence to conclude that the proportion for males is higher than the proportion for females.
Note: Chi-Square Test of a Single Variance; Not all classes cover this topic. From past experience, a statistics teacher has found that the average score on a midterm is 81 with a standard deviation of 5.2. This term, a class of 49 students had a standard deviation of 5 on the midterm. Do the data indicate that we should reject the teacher’s claim that the standard deviation is 5.2? Use .
B: No
Note: F Distribution Test of ANOVA; Not all classes cover this topic. Three loading machines are being compared. Ten samples were taken for each machine. Machine I took an average of 31 minutes to load packages with a standard deviation of 2 minutes. Machine II took an average of 28 minutes to load packages with a standard deviation of 1.5 minutes. Machine III took an average of 29 minutes to load packages with a standard deviation of 1 minute. Find the when testing that the average loading times are the same.
B: p-value is close to 1.
The next three questions refer to the following situation:
A corporation has offices in different parts of the country. It has gathered the following information concerning the number of bathrooms and the number of employees at seven sites:
| Number of employees x | 650 | 730 | 810 | 900 | 102 | 107 | 1150 |
| Number of bathrooms y | 40 | 50 | 54 | 61 | 82 | 110 | 121 |
Is the correlation between the number of employees and the number of bathrooms significant?
B: No
The linear regression equation is:
C:
If a site has 1150 employees, approximately how many bathrooms should it have?
D: We should not be estimating here.
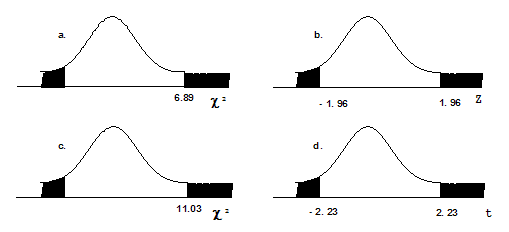
Note: Chi-Square Test of a Single Variance; Not all classes cover this topic. Suppose that a sample of size 10 was collected, with = 4.4 and = 1.4 .
: = 1.6 vs. : ≠ 1.6. Which graph best describes the results of the test?

A
64 backpackers were asked the number of days their latest backpacking trip was. The number of days is given in the table below:
| # of days | 1 | 2 | 3 | 4 | 5 | 6 | 7 | 8 |
| Frequency | 5 | 9 | 6 | 12 | 7 | 10 | 5 | 10 |
Conduct an appropriate test to determine if the distribution is uniform.
A: The is>0.10. There is insufficient information to conclude that the distribution is not uniform.
Note: F Distribution test of One-Way ANOVA; Not all classes cover this topic. Which of the following statements is true when using one-way ANOVA?
C: The test is to determine if the different groups have the same means.

Notification Switch
Would you like to follow the 'Collaborative statistics (with edits: teegarden)' conversation and receive update notifications?