<< Chapter < Page Chapter >> Page >
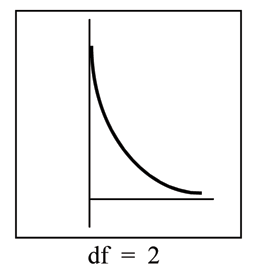
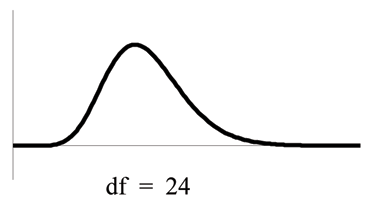
  1. The curve is nonsymmetrical and skewed to the right.
  2. There is a different chi-square curve for each df .
    Example of a nonsymmetrical chi-square curve that has a different df from the graph on the right. The curve begins at (0,∞) and slopes downwards to (∞,0). Example of a nonsymmetrical and skewed to the right, the peak is closer to the left and more values are in the tail on the right, chi-square curve which has a different df from the graph on the left.
  3. The test statistic for any test is always greater than or equal to zero.
  4. When df > 90 , the chi-square curve approximates the normal. For X ~ χ 1000 2 the mean, μ = df = 1000 and the standard deviation, σ = 2 1000 = 44.7 . Therefore, X ~ N ( 1000 , 44.7 ) , approximately.
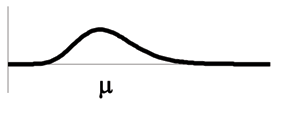
  5. The mean, μ , is located just to the right of the peak.
    Example of how the mean is located to the right of the peak with a nonsymmetrical chi-square curve skewed to the right with the mean on the x-axis.

In the next sections, you will learn about four different applications of the Chi-Square Distribution. These hypothesis tests arealmost always right-tailed tests. In order to understand why the tests are mostly right-tailed, you will need to look carefully at the actualdefinition of the test statistic. Think about the following while you study the next four sections. If the expected and observed values are"far" apart, then the test statistic will be "large" and we will reject in the right tail. The only way to obtain a test statistic very close tozero, would be if the observed and expected values are very, very close to each other. A left-tailed test could be used to determine if the fit were"too good." A "too good" fit might occur if data had been manipulated or invented. Think about the implications of right-tailed versus left-tailedhypothesis tests as you learn the applications of the Chi-Square Distribution.

Get Jobilize Job Search Mobile App in your pocket Now!

Get it on Google Play Download on the App Store Now


Source:  OpenStax, Quantitative information analysis iii. OpenStax CNX. Dec 25, 2009 Download for free at http://cnx.org/content/col11155/1.1
Google Play and the Google Play logo are trademarks of Google Inc.

Notification Switch

Would you like to follow the 'Quantitative information analysis iii' conversation and receive update notifications?

Ask