<< Chapter < Page Chapter >> Page >

Grafieke van trigonometriese funksies

Hierdie afdeling beskryf die grafieke van trigonometriese funksies.

Grafiek van sin θ

Grafiek van sin θ

Volgooi die volgende tabel en gebruik jou sakrekenaar om die waardes te bereken. Stip dan die waardes met sin θ op die y -as en θ op die x -as. Rond die antwoorde af tot 1 desimale plek.

θ 0 30 60 90 120 150
sin θ
θ 180 210 240 270 300 330 360
sin θ

Laat ons terugkyk na ons waardes vir sin θ .

θ 0 30 45 60 90 180
sin θ 0 1 2 1 2 3 2 1 0

Soos jy kan sien, die funksie sin θ het 'n waarde van 0 by θ = 0 . Sy waarde neem egalig toe tot by θ = 90 wanneer sy waarde 1 is. Ons weet ook dat dit later afneem na 0 as θ = 180 . Deur dit alles bymekaar te sit, kan ons 'n idee kry van die volle omvang van die sinuskurwe. Die sinuskurwe word gewys in [link] . Let op die kurwe se vorm, waar elke kurwe die lengte het van 360 . Ons sê die grafiek het 'n periode van 360 . Die hoogte van die kurwe bo (of onder) die x -as word die kurwe se amplitude genoem. Dus is die amplitude van die sinuskurwe is 1.

Die grafiek van y = sin θ

Funksies in die vorm y = a sin ( x ) + q

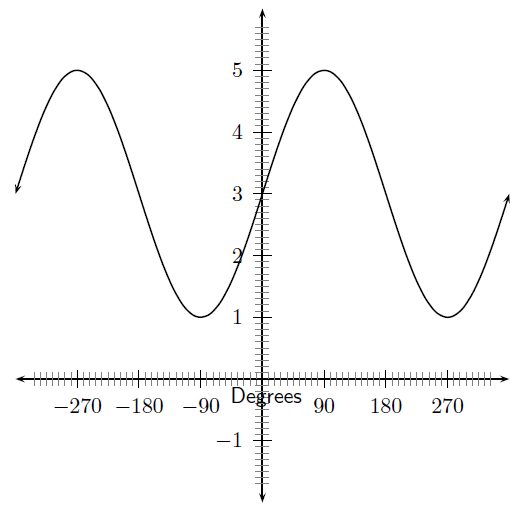
In die vergelyking, y = a sin ( x ) + q , a en q is konstantes en het verskillende invloede op die grafiek van die funksie. Die algemene vorm van hierdie grafiek word gewys in [link] vir die funksie f ( θ ) = 2 sin θ + 3 .

Grafiek van f ( θ ) = 2 sin θ + 3

Funksies van die vorm y = a sin ( θ ) + q :

  1. Op dieselfde stel asse, trek die volgende grafieke:
    1. a ( θ ) = sin θ - 2
    2. b ( θ ) = sin θ - 1
    3. c ( θ ) = sin θ
    4. d ( θ ) = sin θ + 1
    5. e ( θ ) = sin θ + 2
    Gebruik jou resultate om die invloed van q af te lei.
  2. Op dieselfde stel asse, trek die volgende grafieke:
    1. f ( θ ) = - 2 · sin θ
    2. g ( θ ) = - 1 · sin θ
    3. h ( θ ) = 0 · sin θ
    4. j ( θ ) = 1 · sin θ
    5. k ( θ ) = 2 · sin θ
    Gebruik jou resultate om die invloed van a af te lei.

Dis duidelik dat q 'n vertikale verskuiwing teweegbring. As q = 2 , sal die hele sinusgrafiek 2 eenhede opskuif. As q = - 1 , suif die hele grafiek 1 eenheid af.

Hierdie eienskappe word opgesom in [link] .

Jy behoort te vind dat die waarde van a die hoogte van die pieke van die grafiek beïnvloed. As die grootte van a toeneem, word die pieke hoër. As dit afneem, word die pieke laer.

Tabel wat die algemene vorms en posisies van grafieke en funksies in die vorm y = a sin ( x ) + q opsom
a > 0 a < 0
q > 0
q < 0

Gebied en terrein

Vir f ( θ ) = a sin ( θ ) + q , is die gebied { θ : θ R } omdat daar geen waarde is van θ R waarvoor f ( θ ) ongedefinieerd is nie.

Die terrein van f ( θ ) = a sin θ + q hang daarvan af of die waarde vir a positief of negatief is. Ons sal die twee gevalle afsonderlik oorweeg.

As a > 0 we have:

- 1 sin θ 1 - a a sin θ a ( Vermenigvuldiging met 'n positiewe getal handhaaf die aard van die ongelykheid ) - a + q a sin θ + q a + q - a + q f ( θ ) a + q

Dit vertel ons dat vir alle waardes van θ , f ( θ ) altyd tussen - a + q en a + q is. Daarom as a > 0 , is die terrein van f ( θ ) = a sin θ + q dus { f ( θ ) : f ( θ ) [ - a + q , a + q ] } .

Insgelyks, daar kan getoon word dat as a < 0 , dan is die terrein van f ( θ ) = a sin θ + q is { f ( θ ) : f ( θ ) [ a + q , - a + q ] } . Dit word as 'n oefening gelaat.

Die maklikste manier om die terrein te bepaal is om bloot vir die "bokant" en die "onderkant" van die grafiek te soek.

Snypunte

Die y -snypunt, y i n t , van f ( θ ) = a sin ( x ) + q is eenvoudig die waarde van f ( θ ) by θ = 0 .

y i n t = f ( 0 ) = a sin ( 0 ) + q = a ( 0 ) + q = q

Grafiek van cos θ

Grafiek van cos θ :

Voltooi die volgende tabel, gebruik jou sakrekenaar om die waardes korrek tot 1 desimale plek te bereken. Stip dan die waardes met cos θ op die y -as en θ op die x -as.

Questions & Answers

A golfer on a fairway is 70 m away from the green, which sits below the level of the fairway by 20 m. If the golfer hits the ball at an angle of 40° with an initial speed of 20 m/s, how close to the green does she come?
Aislinn Reply
cm
tijani
what is titration
John Reply
what is physics
Siyaka Reply
A mouse of mass 200 g falls 100 m down a vertical mine shaft and lands at the bottom with a speed of 8.0 m/s. During its fall, how much work is done on the mouse by air resistance
Jude Reply
Can you compute that for me. Ty
Jude
what is the dimension formula of energy?
David Reply
what is viscosity?
David
what is inorganic
emma Reply
what is chemistry
Youesf Reply
what is inorganic
emma
Chemistry is a branch of science that deals with the study of matter,it composition,it structure and the changes it undergoes
Adjei
please, I'm a physics student and I need help in physics
Adjanou
chemistry could also be understood like the sexual attraction/repulsion of the male and female elements. the reaction varies depending on the energy differences of each given gender. + masculine -female.
Pedro
A ball is thrown straight up.it passes a 2.0m high window 7.50 m off the ground on it path up and takes 1.30 s to go past the window.what was the ball initial velocity
Krampah Reply
2. A sled plus passenger with total mass 50 kg is pulled 20 m across the snow (0.20) at constant velocity by a force directed 25° above the horizontal. Calculate (a) the work of the applied force, (b) the work of friction, and (c) the total work.
Sahid Reply
you have been hired as an espert witness in a court case involving an automobile accident. the accident involved car A of mass 1500kg which crashed into stationary car B of mass 1100kg. the driver of car A applied his brakes 15 m before he skidded and crashed into car B. after the collision, car A s
Samuel Reply
can someone explain to me, an ignorant high school student, why the trend of the graph doesn't follow the fact that the higher frequency a sound wave is, the more power it is, hence, making me think the phons output would follow this general trend?
Joseph Reply
Nevermind i just realied that the graph is the phons output for a person with normal hearing and not just the phons output of the sound waves power, I should read the entire thing next time
Joseph
Follow up question, does anyone know where I can find a graph that accuretly depicts the actual relative "power" output of sound over its frequency instead of just humans hearing
Joseph
"Generation of electrical energy from sound energy | IEEE Conference Publication | IEEE Xplore" ***ieeexplore.ieee.org/document/7150687?reload=true
Ryan
what's motion
Maurice Reply
what are the types of wave
Maurice
answer
Magreth
progressive wave
Magreth
hello friend how are you
Muhammad Reply
fine, how about you?
Mohammed
hi
Mujahid
A string is 3.00 m long with a mass of 5.00 g. The string is held taut with a tension of 500.00 N applied to the string. A pulse is sent down the string. How long does it take the pulse to travel the 3.00 m of the string?
yasuo Reply
Who can show me the full solution in this problem?
Reofrir Reply
Got questions? Join the online conversation and get instant answers!
Jobilize.com Reply

Get Jobilize Job Search Mobile App in your pocket Now!

Get it on Google Play Download on the App Store Now


Source:  OpenStax, Siyavula textbooks: wiskunde (graad 10) [caps]. OpenStax CNX. Aug 04, 2011 Download for free at http://cnx.org/content/col11328/1.4
Google Play and the Google Play logo are trademarks of Google Inc.

Notification Switch

Would you like to follow the 'Siyavula textbooks: wiskunde (graad 10) [caps]' conversation and receive update notifications?

Ask