

| << Chapter < Page | Chapter >> Page > |
Let's compare two devices that, at first glance, appear to solve the same problem: the TPS54140A and TPS62160 switch-mode buck regulators. Both of these devices are perfectly capable of generating 3.3 V with +/-3 percent accuracy from a loosely regulated (12 V +/-10 percent) input voltage. However, observing some of the details of each device from the data sheet will show that the TPS54140A may be the better choice for some types of applications, while the TPS62160 is more suited for others. First, observe the basic schematic shown on the first page of each device’s data sheet, as in Figure 5.
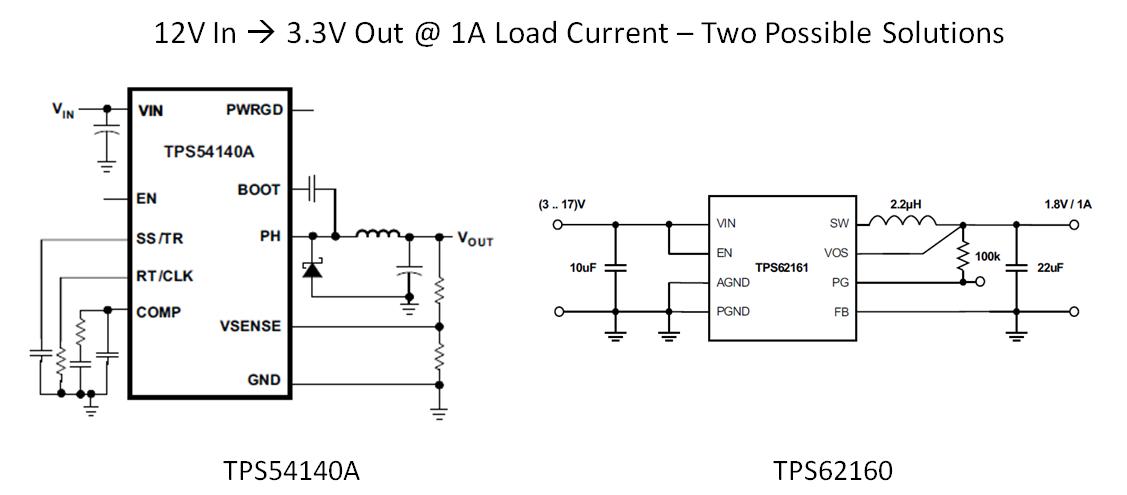
From the schematic, you can immediately see that the TPS54140A has more external components associated with it. You can check the cost of the devices on the website as well, so the TPS54140A solution will likely have higher total cost and design complexity compared to the TPS62160. But because certain performance parameters can be controlled externally with the TPS54140A, you have a greater degree of flexibility to adjust operating characteristics such as the switching (clock) frequency or startup times by changing the external component values. (This is not possible with the TPS62160, which has all of these characteristics fixed internally to the silicon). Next, look at the efficiency plots in each data sheet (Figure 6).
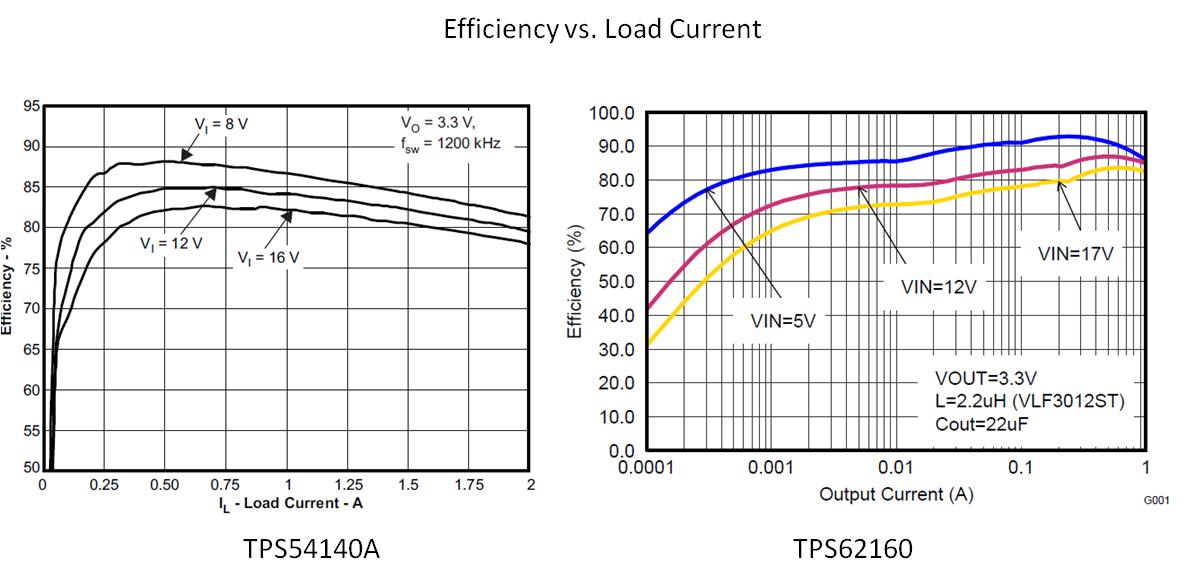
A few differences are immediately obvious. First of all, the TPS54140A plot is shown using a linear scale for the load current axis, while the TPS62160 uses a logarithmic scale. This is because the TPS62160 is optimized to work in applications that require high efficiency over a wide range of loads, including very light loads (such as processors that may be in standby mode). The TPS54140A, on the other hand, is primarily intended to handle higher load currents (and is tolerant to much higher input voltage ranges as well). Thus, for applications that require high efficiency at very light loads, the TPS62160 will be the better choice. On the other hand, if you need a more rugged or robust solution to handle continuous high current, the TPS54140A may be a better option.
Now take a look at the transient response plots in each data sheet (see Figure 7). Not all data sheets will show test data for the exact same conditions. If you need a true apples-to-apples comparison, you can test each circuit using the EVM for each device using identical load conditions.
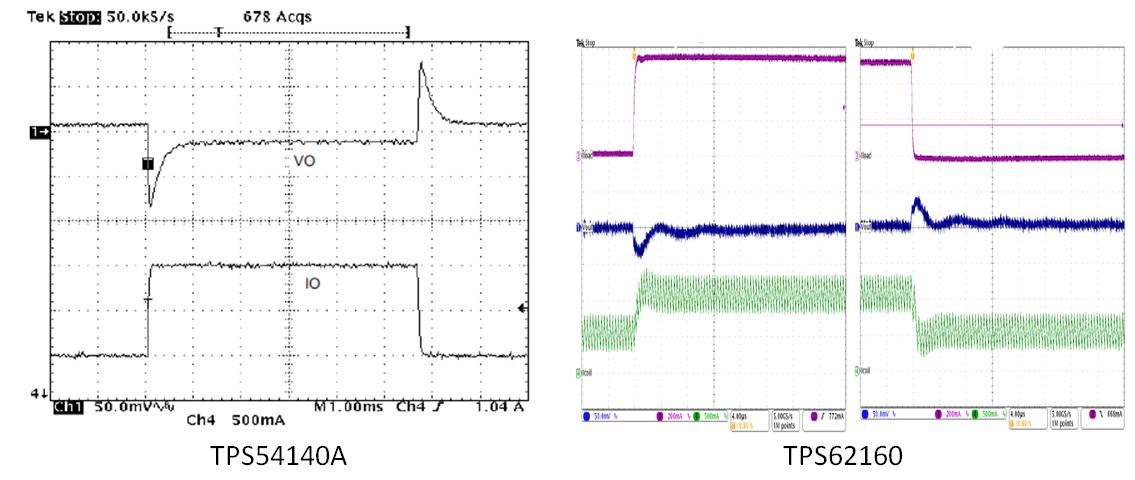
Look at the two most similar plots available from the respective data sheets. The TPS54140A plot shows an output voltage response (top trace) to a 0- to 1-A load current step (bottom trace), while the TPS62160 plot shows the output voltage response (blue) and inductor current (green) for a 500-mA to 1-A load current step (purple). The horizontal scale for the TPS54140A plot on the left side is 1 mS/division. The corresponding scale for the TPS62160 plot is 4 µS/division. So, you can see that the TPS62160 has a much faster settling time (several microseconds) than the TPS54140A (nearly 1 ms) for a comparable load transient.
Notification Switch
Would you like to follow the 'Senior project guide to texas instruments components' conversation and receive update notifications?

|
|

|
|

|
|

|
|

|
|

|
|

|
|
|
|
|

|
|

|