| << Chapter < Page | Chapter >> Page > |
Receiver sensitivity
Noise is a phenomenon that degrades signal quality and impairs the receiver’s ability to make correct decisions about symbol detection. Thermal noise is a zero-mean Gaussian random process and processes the same power spectral density for all frequencies of interest. It is superimposed on a signal as it travels through the communication chain, and therefore has an additive effect. It is thus commonly referred to as additive white Gaussian noise (AWGN). The power spectral density of double-sided white noise is N0/2. At room temperature, single-sided noise power spectral density in the 1-Hz bandwidth is calculated with Equation 3:
![]()
The signal at the receiver is very small in magnitude and must be amplified before any meaningful information can be extracted from it. This is done using high gain amplifiers at the front end. The amplifiers also amplify noise and interference already present in the signal, and might even add their own noise to the processed signal. Such broadband noise is another reason why bandpass filters are used in the front end of a receiver. They attenuate out-of-band noise while keeping the signal of interest unchanged, thereby increasing the SNR.
Receiver sensitivity is the weakest RF signal that can be processed to develop a minimum SNR for achieving the required bit-error-rate (BER) performance. In AWGN, the sensitivity of a receiver can be derived from its noise figure. The noise factor of a receiver from the antenna port to the output of a detector is expressed in Equation 4 as the ratio of the SNR at the input to the SNR at the output.
![]()
Noise figure is a measure of how much a system adds noise to a signal as it passes through it. It is given by 10 * log(F)(dB). Assuming that minimum SNR is required for obtaining the defined error rate, the corresponding sensitivity level is calculated with Equation 5:
![]()
Where:
10 log(kTo) = -174 dBm/Hz is from (2.8)
Receiver noise bandwidth B is in Hz
NF = the overall noise figure of the receiver in dB
Data sheets specify this quantity for a specific bandwidth and BER performance. Therefore, it is often advantageous to use the smallest possible data rate in order to be able to use the smallest possible receiver bandwidth. Consider a Wi-Fi device with -83 dBm input sensitivity, a ZigBee at -97 dBm and a narrowband radio (CC1120) at -123 dBm.
From the Friss equation, you learned that for about every 6 dB in output power or input sensitivity, the range of the wireless system doubles. Therefore, a 40-dB improvement will equate to approximately 100 times the range.
Adjacent channel selectivity
Many different users must be able to broadcast at the same time. This necessitates separating the desired transmission from all the others at the receiver. One standard method is to allocate different frequency bands to various users; signals from different users can be separated using bandpass filters. Practical receive filters do not completely attenuate the frequency content of out-of-band signals, nor do they pass in-band signals completely distortion-free. Therefore, there is a requirement on the transmitters to spill the least amount of power in the adjacent bands.
This value is typically measured by applying a signal 3 dB above the sensitivity level of the system, adding a blocking signal in the adjacent channel, and increasing the power of the blocker until the receiver BER becomes the same as measured with 3 dB less signal and no blocker.
Maximum power is limited by nonlinearities
The building blocks of a receiver generate harmonics (tones at an integer multiple of the fundamental frequency) due to nonlinearities. This causes the translation of out-of-band frequencies onto in-band channels, thereby degrading SNR.
Harmonic distortion is the ratio of the amplitude of a particular tone to the fundamental. It is usually not a problem in a receiver and can be filtered out after the LNA. Cross-modulation occurs when a strong interferer and a weak desired signal present themselves at the front end. Amplitude modulation on the strong interferer is transferred to the desired signal through interaction with a receiver’s nonlinearity. A figure of merit of a receiver is the 1-dB compression point, P1dB, where the gain of the system is reduced by 1 dB as input power increases. Receiver sensitivity and the input 1-dB compression point set the dynamic range of a receiver.
Multitone distortions
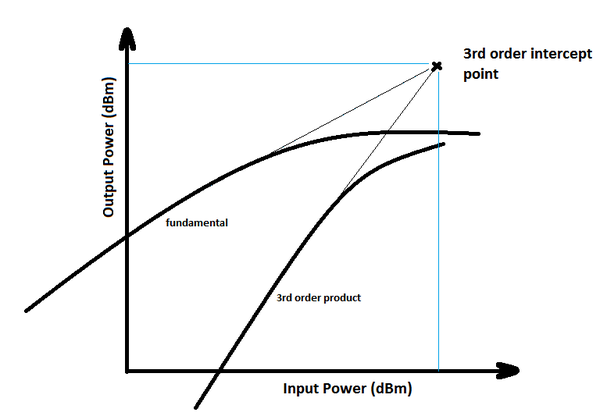
Intermodulation distortions arise when more than one tone is present at the input. The third-order intercept point (IP3), which is measured by a two-tone test, shows to what extent the receiver can handle an environment with strong undesired signals. Second- and third-order intermodulation products are problematic in a receiver, as they fall very close to its operating frequency. The amplitude of the fundamental signal increases in proportion to the input signal, whereas the third-order intermodulation product increases as a cube of the fundmental. The IP3 is defined as the intersection of two lines in Figure 3 below.

Figure 3
Wireless systems operate in an environment where they encounter strong interfering signals from other transmitters. Since a large signal tends to reduce the average gain of the circuit, the weak signal may experience a diminishingly small gain. This is called desensitization, and for a large-enough interferer, the gain for the weak desired signal goes to zero and the signal is blocked.
An interferer that desensitizes a circuit even if the gain doesn’t go to zero is called a blocker. Receivers must be able to withstand a blocking signal 60 to 70 dB greater than the desired signal. This information is specified in data sheets as adjacent and alternate channel-rejection performance of radio-frequency integrated circuits.
Conclusion
TI’s wireless technology boasts a range of products, from low-power applications to cellular baseband processors. In low-power applications, TI has a broad range of devices that can suit any application, from consumer/personal networking to industrial monitoring and asset tracking. TI can provide complete solutions with reference designs, hardware development kits and software to jumpstart any wireless project, ranging from sub-1 GHz to ZigBee low-power networking and the Internet of things.
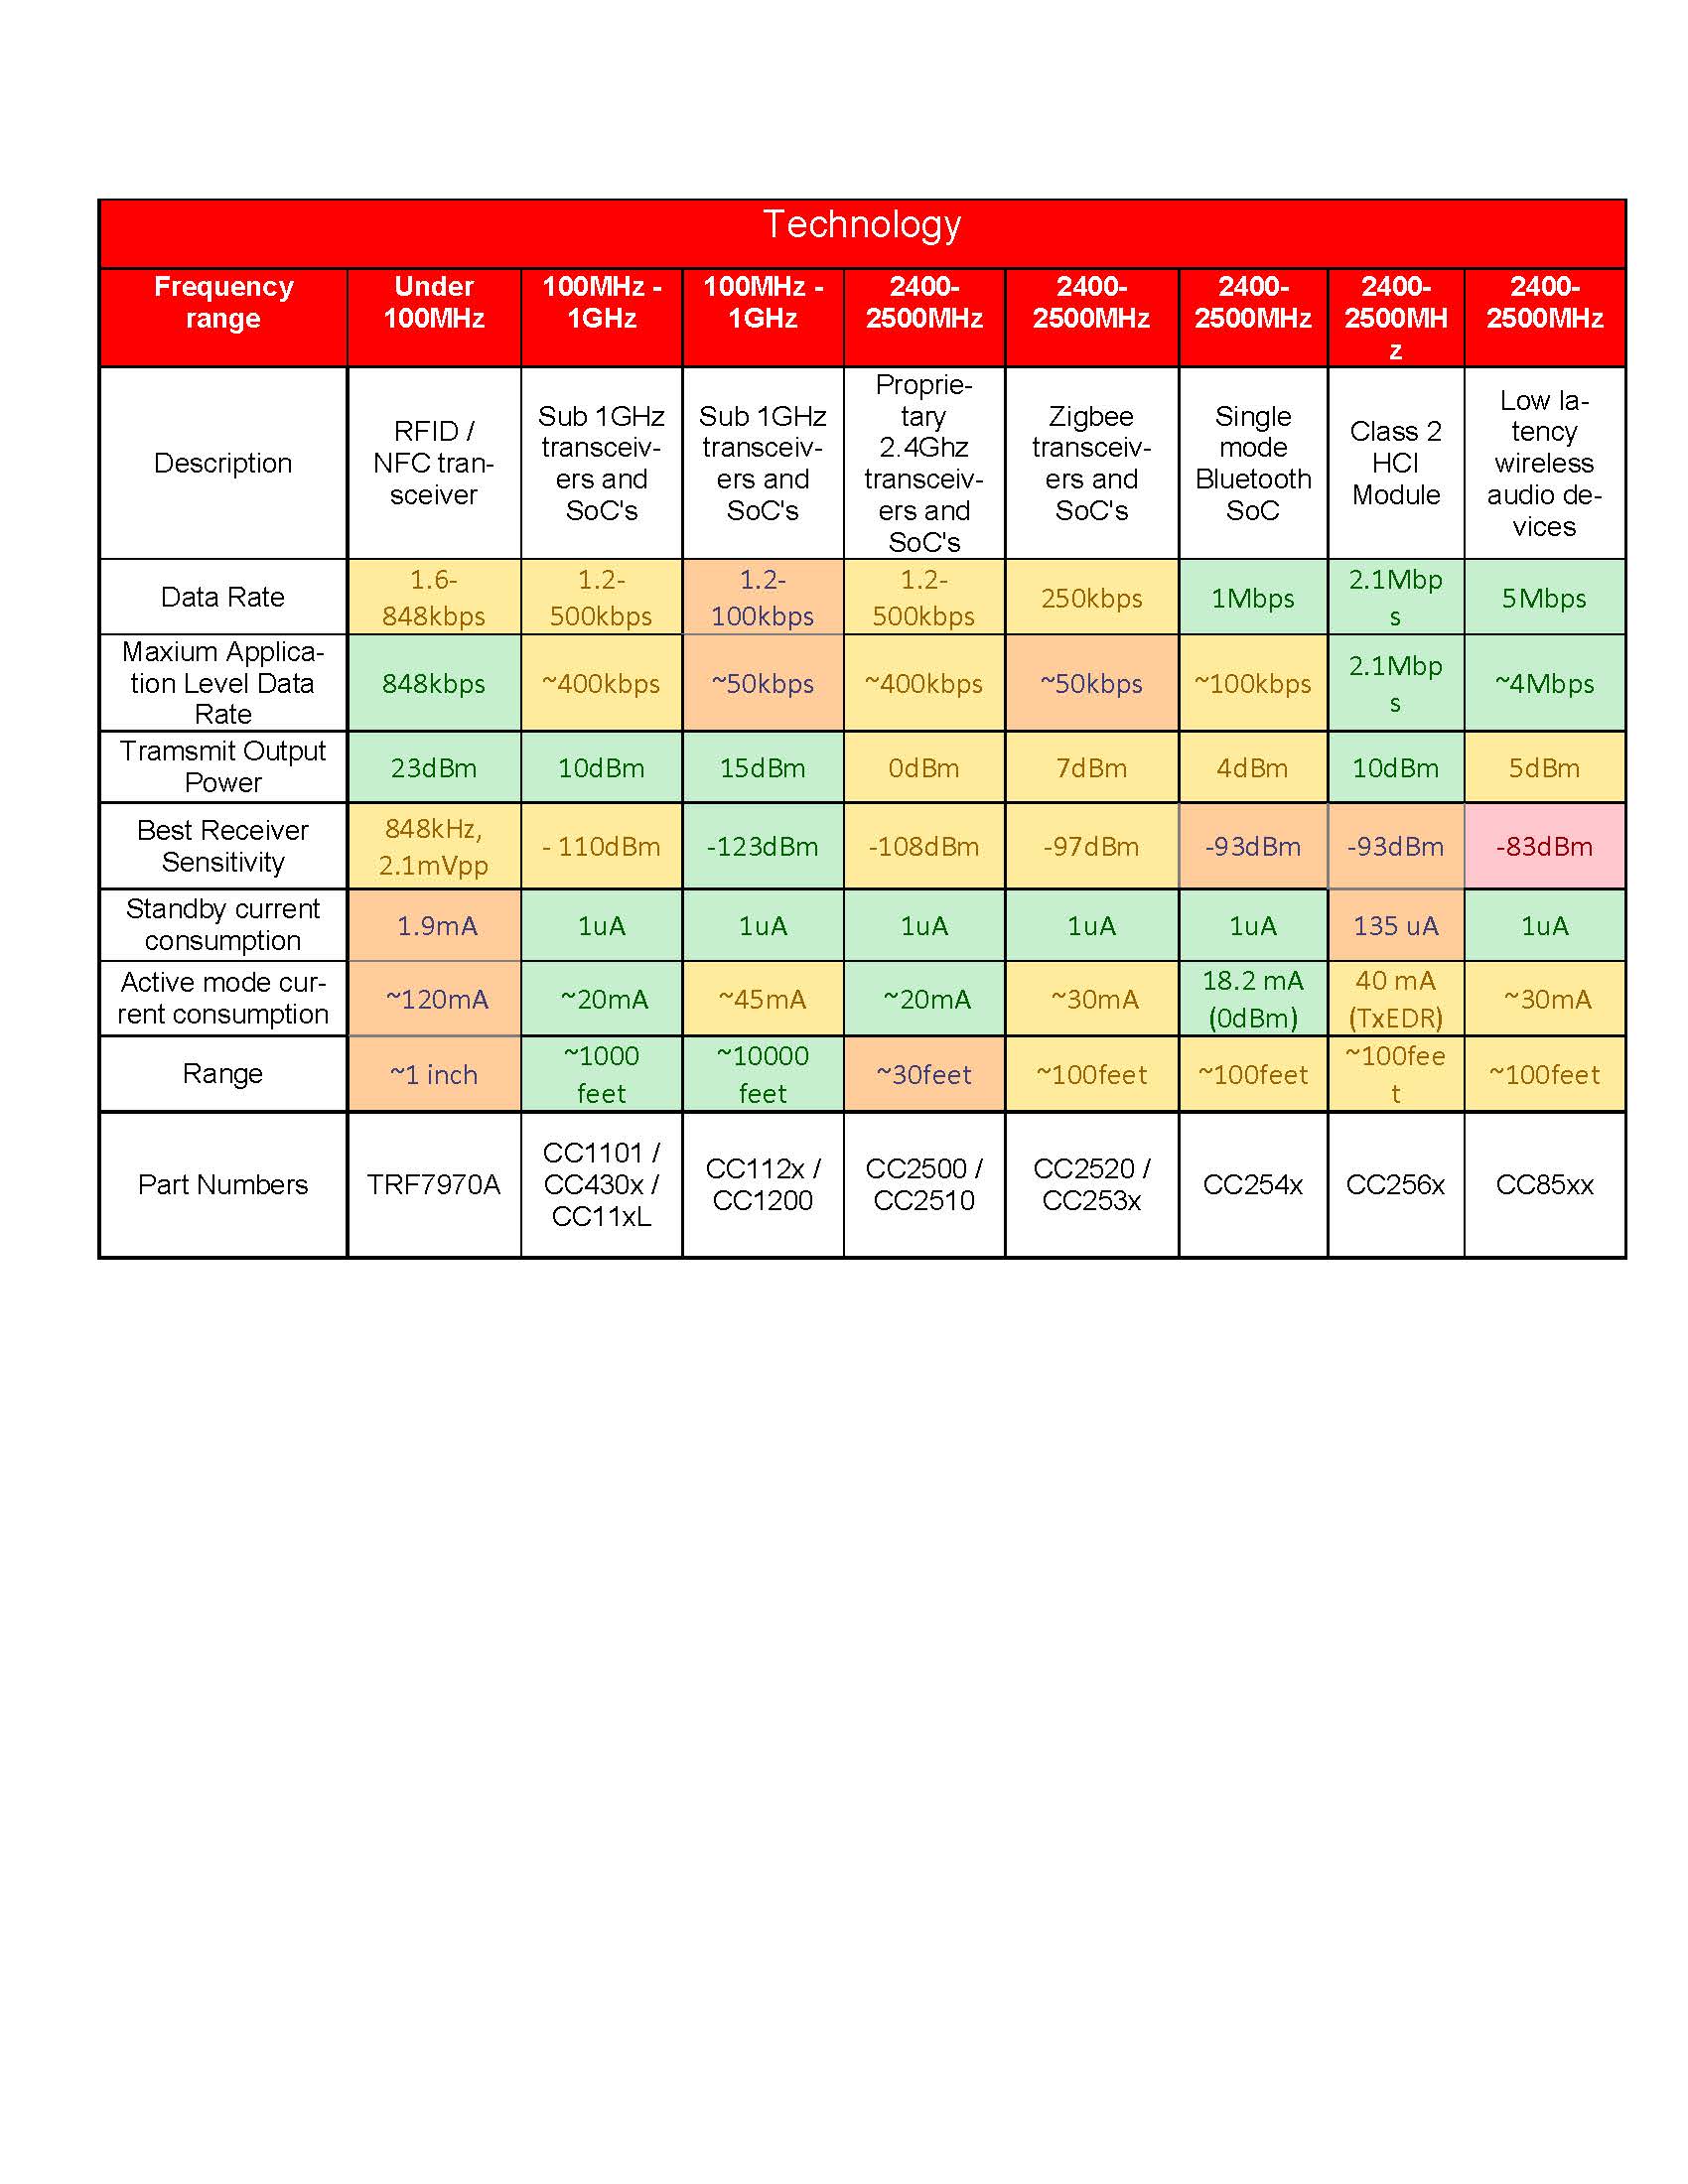
A few of TI's products for low-power wireless applications are listed in Table 1.
Table 1. TI Products for low power wireless applications.


Notification Switch
Would you like to follow the 'Senior project guide to texas instruments components' conversation and receive update notifications?