<< Chapter < Page Chapter >> Page >
Basic directions on how to use Google Spreadsheet and Excel to explore and summarize data.

Getting started with spreadsheets

In this section we will discuss techniques using spreadsheet for inspecting quantitative and qualitative data particularly for summarizing frequency, relative frequency and cumulative relative frequency. We will primarily use Microsoft Excel and Google Spreadsheet, as we will use these two resources for sampling and surveying in this introductory course. We will also introduce Google Fusion for a quick look at data found on the internet. First let’s explore the components of most spreadsheet programs.

Common characteristics of spreadsheets

Most spreadsheets have some characteristics in common. They have a Ribbon and commands at the top of the file, a series of columns identified by the alphabet and a series of rows identified by the counting numbers, a formula bar , and a space at the bottom of the page for “ worksheets ” within the file or notebook. Below is a screenshot of Excel 2013 and Google Spreadsheet (found in Google Drive). Again if you are using a different version of either of these products, directions may vary but the concepts will be the same. Please note that the Excel ribbon contains 8 tabs: File, Home, Insert, Page Layout, Formulas, Data, Review, and View. Google Spreadsheet contains 8 tabs also File, Edit, View, Insert, Format, Data, Tools, and Help. I will draw you attention to these tabs as we proceed.
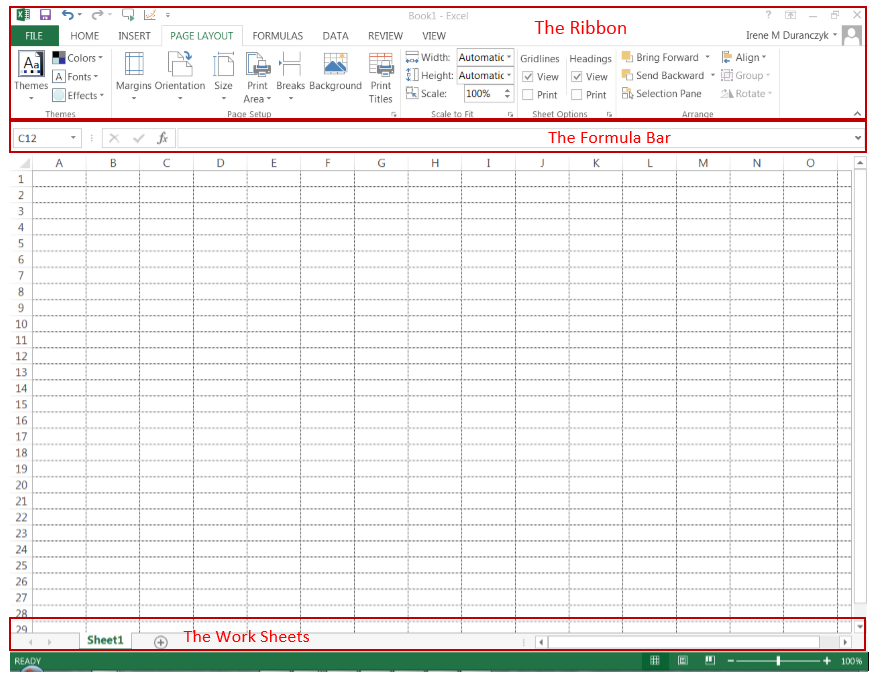
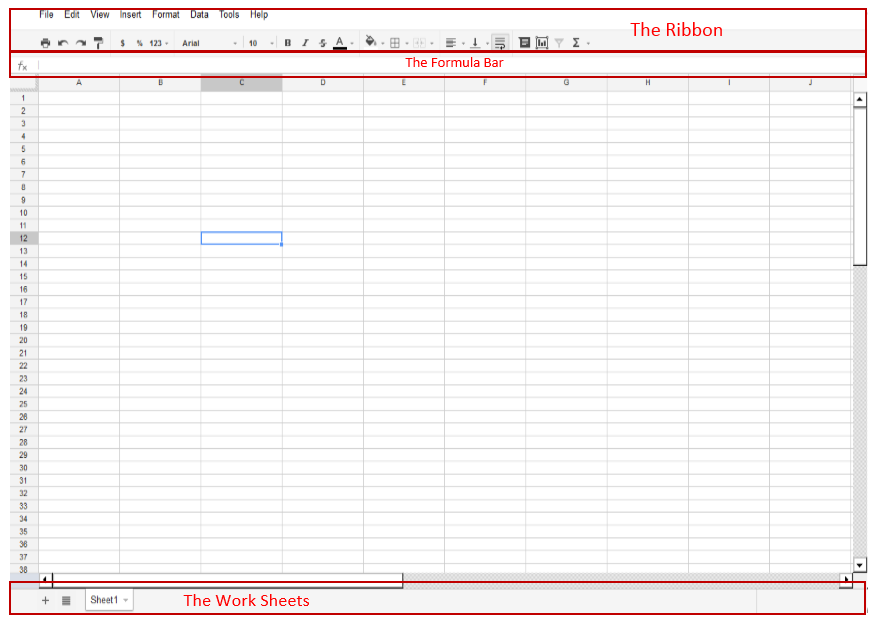
Although the ribbons at the top appear quite different, they both contain the same elements, such as File, View, Insert, Data, and Help. Many of the other functions that they have in common are “housed” in other pull down menus on the ribbon. Both spreadsheets will allow us to add data cells, label data columns and rows, calculate frequency, relative frequency, cumulative relative frequency, and create graphs and charts based on our data summaries. Let’s get started!

Prepatory work for summarizing data with excel and google spreadsheet

Downloading data from Moodle: We will begin our use of a spreadsheet by using a file of data supplied by your instructor. This file will contain rows and columns. The first row will have the titles of each of the columns. The first column will be individual data cases, the other columns will be either quantitative (discrete or continuous) or qualitative data (ordinal and nominal). To move a file from the course shell to Excel you will:

  1. Locate the file you want to download from the server or the course management system. If you click on the file it will either download or open in Excel or Google Spreadsheet. When you have opened the file in Excel. Go to step 2.
  2. Save the file to your local computer file space, your thumb drive, dropbox, or another cloud storage space. If you are not using a remote storage space, email the saved file to yourself at the end of the class session since individual computers may not store your data after you log out. Be sure to give your file a name that includes your first and last name. It is difficult for an instructor to keep track of files when all students have labeled files exactly the same. Your file name should include your identity and the assignment title. For, instance: samplinganddataIreneDuranczyk.xlx. NOTE: If you do not download the file and save the file first, your data may be lost or you may not be able to edit your data. Once you have saved the file continue with this guided lesson.

Questions & Answers

what's atoms
Achol Reply
discuss how the following factors such as predation risk, competition and habitat structure influence animal's foraging behavior in essay form
Burnet Reply
location of cervical vertebra
KENNEDY Reply
What are acid
Sheriff Reply
define biology infour way
Happiness Reply
What are types of cell
Nansoh Reply
how can I get this book
Gatyin Reply
what is lump
Chineye Reply
what is cell
Maluak Reply
what is biology
Maluak
what's cornea?
Majak Reply
what are cell
Achol
Explain the following terms . (1) Abiotic factors in an ecosystem
Nomai Reply
Abiotic factors are non living components of ecosystem.These include physical and chemical elements like temperature,light,water,soil,air quality and oxygen etc
Qasim
Define the term Abiotic
Marial
what is biology
daniel Reply
what is diffusion
Emmanuel Reply
passive process of transport of low-molecular weight material according to its concentration gradient
AI-Robot
what is production?
Catherine
hello
Marial
Pathogens and diseases
how did the oxygen help a human being
Achol Reply
Got questions? Join the online conversation and get instant answers!
Jobilize.com Reply

Get Jobilize Job Search Mobile App in your pocket Now!

Get it on Google Play Download on the App Store Now


Source:  OpenStax, Collaborative statistics using spreadsheets. OpenStax CNX. Jan 05, 2016 Download for free at http://legacy.cnx.org/content/col11521/1.23
Google Play and the Google Play logo are trademarks of Google Inc.

Notification Switch

Would you like to follow the 'Collaborative statistics using spreadsheets' conversation and receive update notifications?

Ask