<< Chapter < Page Chapter >> Page >

In many ecosystems, the bottom of the food chain consists of photosynthetic organisms (plants and/or phytoplankton), which are called primary producers . The organisms that consume the primary producers are herbivores: the primary consumers . Secondary consumers are usually carnivores that eat the primary consumers. Tertiary consumers are carnivores that eat other carnivores. Higher-level consumers feed on the next lower tropic levels, and so on, up to the organisms at the top of the food chain: the apex consumers . In the Lake Ontario food chain shown in [link] , the Chinook salmon is the apex consumer at the top of this food chain.
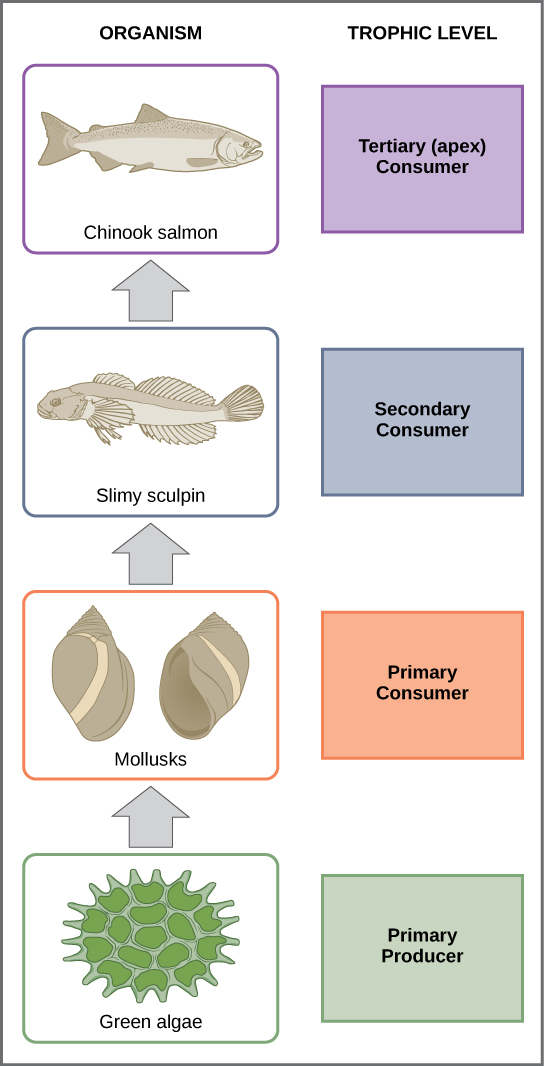
 In this illustration the bottom trophic level is the primary producer, which is green algae. The primary consumers are mollusks, or snails. The secondary consumers are small fish called slimy sculpin. The tertiary and apex consumer is Chinook salmon.
These are the trophic levels of a food chain in Lake Ontario at the United States-Canada border. Energy and nutrients flow from photosynthetic green algae at the bottom to the top of the food chain: the Chinook salmon.

One major factor that limits the length of food chains is energy. Energy is lost as heat between each trophic level due to the second law of thermodynamics. Thus, after a limited number of trophic energy transfers, the amount of energy remaining in the food chain may not be great enough to support viable populations at yet a higher trophic level.

The loss of energy between trophic levels is illustrated by the pioneering studies of Howard T. Odum in the Silver Springs, Florida, ecosystem in the 1940s ( [link] ). The primary producers generated 20,819 kcal/m 2 /yr (kilocalories per square meter per year), the primary consumers generated 3368 kcal/m 2 /yr, the secondary consumers generated 383 kcal/m 2 /yr, and the tertiary consumers only generated 21 kcal/m 2 /yr. Thus, there is little energy remaining for another level of consumers in this ecosystem.
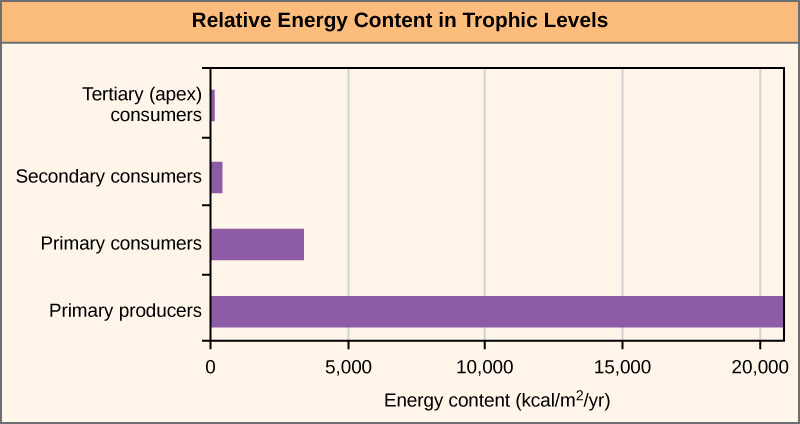
 Graph shows energy content in different trophic levels. The energy content of primary producers is over 20,000 kilocalories per meter squared per year. The energy content of primary consumers is much smaller, about 3,400 kilocalories per meter squared per year. The energy content of secondary consumers is 383 kilocalories per meter squared per year, and the energy content of tertiary consumers is only 21 kilocalories per meter squared per year.
The relative energy in trophic levels in a Silver Springs, Florida, ecosystem is shown. Each trophic level has less energy available and supports fewer organisms at the next level.

There is a one problem when using food chains to accurately describe most ecosystems. Even when all organisms are grouped into appropriate trophic levels, some of these organisms can feed on species from more than one trophic level; likewise, some of these organisms can be eaten by species from multiple trophic levels. In other words, the linear model of ecosystems, the food chain, is not completely descriptive of ecosystem structure. A holistic model—which accounts for all the interactions between different species and their complex interconnected relationships with each other and with the environment—is a more accurate and descriptive model for ecosystems. A food web    is a graphic representation of a holistic, non-linear web of primary producers, primary consumers, and higher-level consumers used to describe ecosystem structure and dynamics ( [link] ).
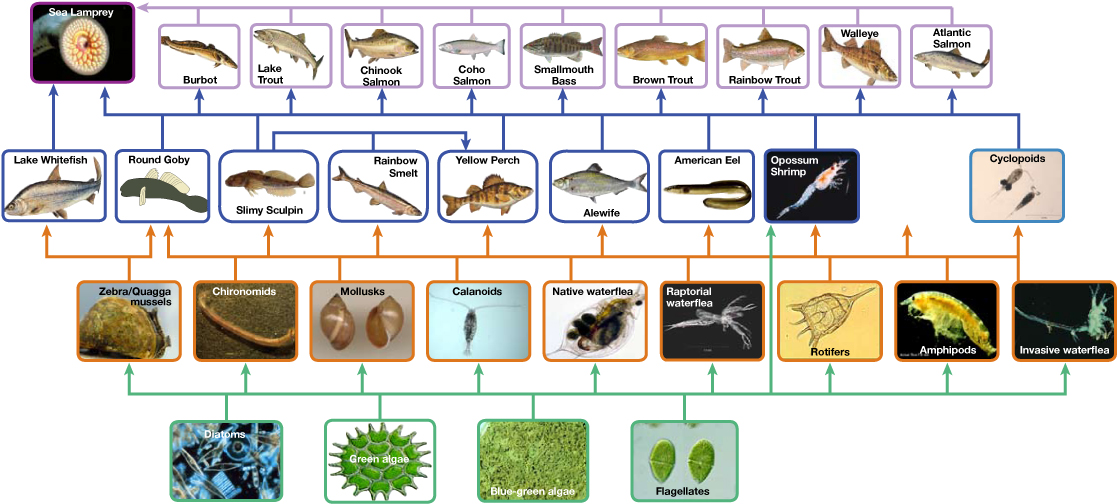
 The bottom level of the illustration shows primary producers, which include diatoms, green algae, blue-green algae, flagellates, and rotifers. The next level includes the primary consumers that eat primary producers. These include calanoids, waterfleas, and cyclopoids, rotifers and amphipods. The shrimp also eats primary producers. Primary consumers are in turn eaten by secondary consumers, which are typically small fish. The small fish are eaten by larger fish, the tertiary, or apex consumers. The yellow perch, a secondary consumer, eats small fish within its own trophic level. All fish are eaten by the sea lamprey. Thus, the food web is complex with interwoven layers.
This food web shows the interactions between organisms across trophic levels in the Lake Ontario ecosystem. Primary producers are outlined in green, primary consumers in orange, secondary consumers in blue, and tertiary (apex) consumers in purple. Arrows point from an organism that is consumed to the organism that consumes it. Notice how some lines point to more than one trophic level. For example, the opossum shrimp eats both primary producers and primary consumers. (credit: NOAA, GLERL)

Questions & Answers

A golfer on a fairway is 70 m away from the green, which sits below the level of the fairway by 20 m. If the golfer hits the ball at an angle of 40° with an initial speed of 20 m/s, how close to the green does she come?
Aislinn Reply
cm
tijani
what is titration
John Reply
what is physics
Siyaka Reply
A mouse of mass 200 g falls 100 m down a vertical mine shaft and lands at the bottom with a speed of 8.0 m/s. During its fall, how much work is done on the mouse by air resistance
Jude Reply
Can you compute that for me. Ty
Jude
what is the dimension formula of energy?
David Reply
what is viscosity?
David
what is inorganic
emma Reply
what is chemistry
Youesf Reply
what is inorganic
emma
Chemistry is a branch of science that deals with the study of matter,it composition,it structure and the changes it undergoes
Adjei
please, I'm a physics student and I need help in physics
Adjanou
chemistry could also be understood like the sexual attraction/repulsion of the male and female elements. the reaction varies depending on the energy differences of each given gender. + masculine -female.
Pedro
A ball is thrown straight up.it passes a 2.0m high window 7.50 m off the ground on it path up and takes 1.30 s to go past the window.what was the ball initial velocity
Krampah Reply
2. A sled plus passenger with total mass 50 kg is pulled 20 m across the snow (0.20) at constant velocity by a force directed 25° above the horizontal. Calculate (a) the work of the applied force, (b) the work of friction, and (c) the total work.
Sahid Reply
you have been hired as an espert witness in a court case involving an automobile accident. the accident involved car A of mass 1500kg which crashed into stationary car B of mass 1100kg. the driver of car A applied his brakes 15 m before he skidded and crashed into car B. after the collision, car A s
Samuel Reply
can someone explain to me, an ignorant high school student, why the trend of the graph doesn't follow the fact that the higher frequency a sound wave is, the more power it is, hence, making me think the phons output would follow this general trend?
Joseph Reply
Nevermind i just realied that the graph is the phons output for a person with normal hearing and not just the phons output of the sound waves power, I should read the entire thing next time
Joseph
Follow up question, does anyone know where I can find a graph that accuretly depicts the actual relative "power" output of sound over its frequency instead of just humans hearing
Joseph
"Generation of electrical energy from sound energy | IEEE Conference Publication | IEEE Xplore" ***ieeexplore.ieee.org/document/7150687?reload=true
Ryan
what's motion
Maurice Reply
what are the types of wave
Maurice
answer
Magreth
progressive wave
Magreth
hello friend how are you
Muhammad Reply
fine, how about you?
Mohammed
hi
Mujahid
A string is 3.00 m long with a mass of 5.00 g. The string is held taut with a tension of 500.00 N applied to the string. A pulse is sent down the string. How long does it take the pulse to travel the 3.00 m of the string?
yasuo Reply
Who can show me the full solution in this problem?
Reofrir Reply
Got questions? Join the online conversation and get instant answers!
Jobilize.com Reply

Get Jobilize Job Search Mobile App in your pocket Now!

Get it on Google Play Download on the App Store Now


Source:  OpenStax, Bio 351 university of texas. OpenStax CNX. Dec 31, 2015 Download for free at https://legacy.cnx.org/content/col11943/1.1
Google Play and the Google Play logo are trademarks of Google Inc.

Notification Switch

Would you like to follow the 'Bio 351 university of texas' conversation and receive update notifications?

Ask