| << Chapter < Page | Chapter >> Page > |
Economists use a vocabulary of maximizing utility to describe people’s preferences. In Consumer Choices , the level of utility that a person receives is described in numerical terms. This appendix presents an alternative approach to describing personal preferences, called indifference curves, which avoids any need for using numbers to measure utility. By setting aside the assumption of putting a numerical valuation on utility—an assumption that many students and economists find uncomfortably unrealistic—the indifference curve framework helps to clarify the logic of the underlying model.
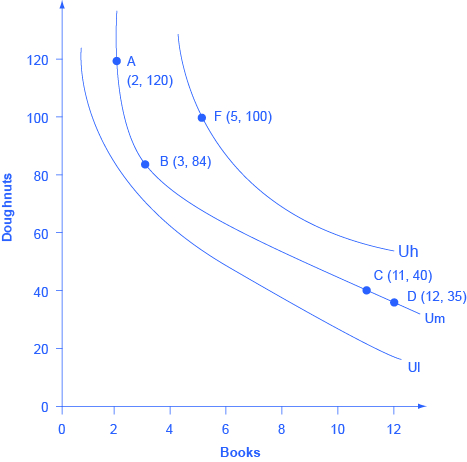
People cannot really put a numerical value on their level of satisfaction. However, they can, and do, identify what choices would give them more, or less, or the same amount of satisfaction. An indifference curve shows combinations of goods that provide an equal level of utility or satisfaction. For example, [link] presents three indifference curves that represent Lilly’s preferences for the tradeoffs that she faces in her two main relaxation activities: eating doughnuts and reading paperback books. Each indifference curve (Ul, Um, and Uh) represents one level of utility. First we will explore the meaning of one particular indifference curve and then we will look at the indifference curves as a group.

The Shape of an Indifference Curve
The indifference curve Um has four points labeled on it: A, B, C, and D. Since an indifference curve represents a set of choices that have the same level of utility, Lilly must receive an equal amount of utility, judged according to her personal preferences, from two books and 120 doughnuts (point A), from three books and 84 doughnuts (point B) from 11 books and 40 doughnuts (point C) or from 12 books and 35 doughnuts (point D). She would also receive the same utility from any of the unlabeled intermediate points along this indifference curve.
Indifference curves have a roughly similar shape in two ways: 1) they are downward sloping from left to right; 2) they are convex with respect to the origin. In other words, they are steeper on the left and flatter on the right. The downward slope of the indifference curve means that Lilly must trade off less of one good to get more of the other, while holding utility constant. For example, points A and B sit on the same indifference curve Um, which means that they provide Lilly with the same level of utility. Thus, the marginal utility that Lilly would gain from, say, increasing her consumption of books from two to three must be equal to the marginal utility that she would lose if her consumption of doughnuts was cut from 120 to 84—so that her overall utility remains unchanged between points A and B. Indeed, the slope along an indifference curve is referred to as the marginal rate of substitution , which is the rate at which a person is willing to trade one good for another so that utility will remain the same.

Notification Switch
Would you like to follow the 'University of houston downtown: microeconomics' conversation and receive update notifications?