| << Chapter < Page | Chapter >> Page > |
Of course, economic models express relationships using economic variables, like Budget = money_spent_on_econ_books + money_spent_on_music, assuming that the only things you buy are economics books and music.
Most of the relationships we use in this course are expressed as linear equations of the form:
Expressing Equations Graphically
Graphs are useful for two purposes. The first is to express equations visually, and the second is to display statistics or data. This section will discuss expressing equations visually.
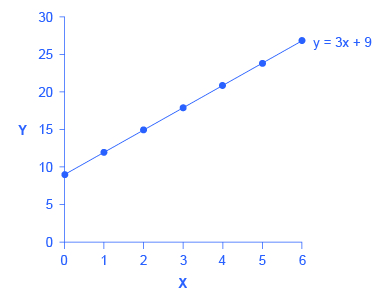
To a mathematician or an economist, a variable is the name given to a quantity that may assume a range of values. In the equation of a line presented above, x and y are the variables, with x on the horizontal axis and y on the vertical axis, and b and m representing factors that determine the shape of the line. To see how this equation works, consider a numerical example:
In this equation for a specific line, the b term has been set equal to 9 and the m term has been set equal to 3. [link] shows the values of x and y for this given equation. [link] shows this equation, and these values, in a graph. To construct the table, just plug in a series of different values for x, and then calculate what value of y results. In the figure, these points are plotted and a line is drawn through them.
| x | y |
|---|---|
| 0 | 9 |
| 1 | 12 |
| 2 | 15 |
| 3 | 18 |
| 4 | 21 |
| 5 | 24 |
| 6 | 27 |

This example illustrates how the b and m terms in an equation for a straight line determine the shape of the line. The b term is called the y-intercept. The reason for this name is that, if x = 0, then the b term will reveal where the line intercepts, or crosses, the y-axis. In this example, the line hits the vertical axis at 9. The m term in the equation for the line is the slope. Remember that slope is defined as rise over run; more specifically, the slope of a line from one point to another is the change in the vertical axis divided by the change in the horizontal axis. In this example, each time the x term increases by one (the run), the y term rises by three. Thus, the slope of this line is three. Specifying a y-intercept and a slope—that is, specifying b and m in the equation for a line—will identify a specific line. Although it is rare for real-world data points to arrange themselves as an exact straight line, it often turns out that a straight line can offer a reasonable approximation of actual data.
Interpreting the Slope
The concept of slope is very useful in economics, because it measures the relationship between two variables. A positive slope means that two variables are positively related; that is, when x increases, so does y, or when x decreases, y decreases also. Graphically, a positive slope means that as a line on the line graph moves from left to right, the line rises. The length-weight relationship, shown in [link] later in this Appendix, has a positive slope. We will learn in other chapters that price and quantity supplied have a positive relationship; that is, firms will supply more when the price is higher.

Notification Switch
Would you like to follow the 'Principles of economics' conversation and receive update notifications?