-
Home
- Calculating basic statistical
- Calculating basic statistical
- Calculating descriptive statistics
- * Charts (optional, use only if you want a visual depiction of your data)
- * Histograms (optional, use only if you want a visual depiction of your data)with normal curve
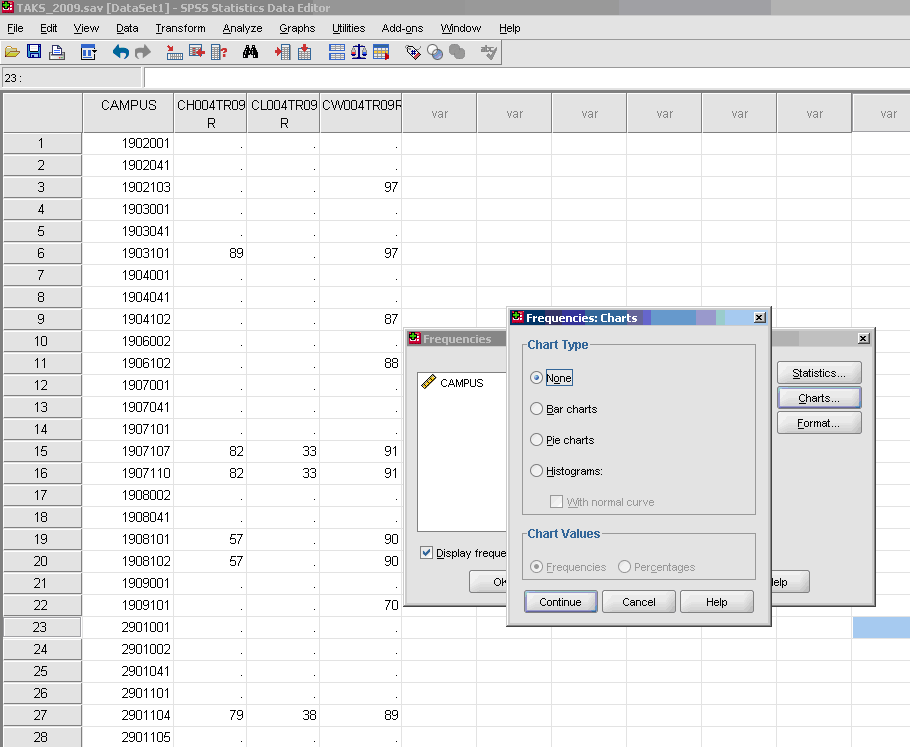
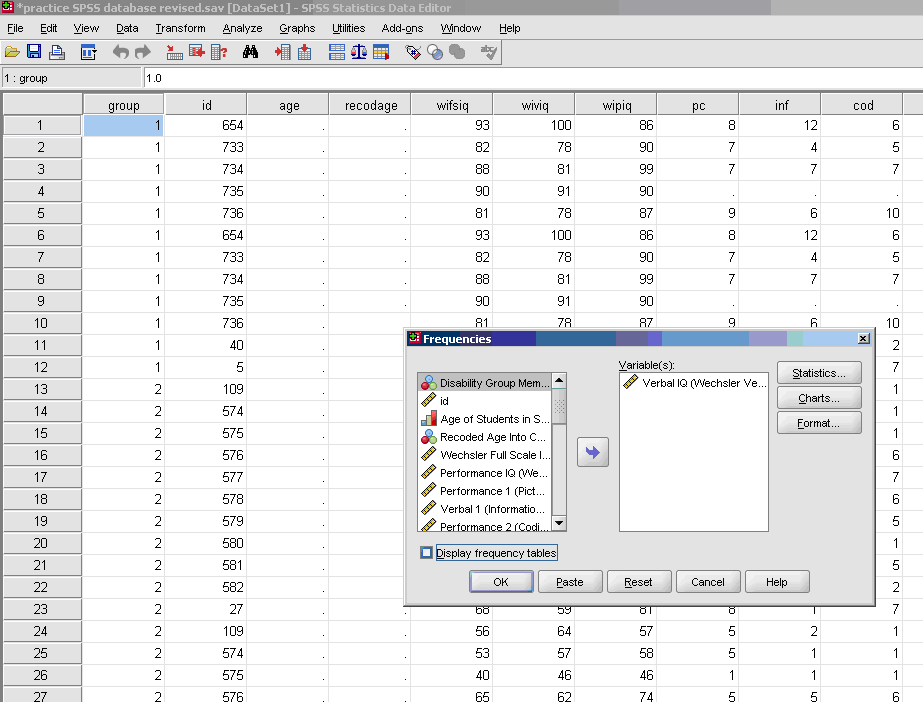
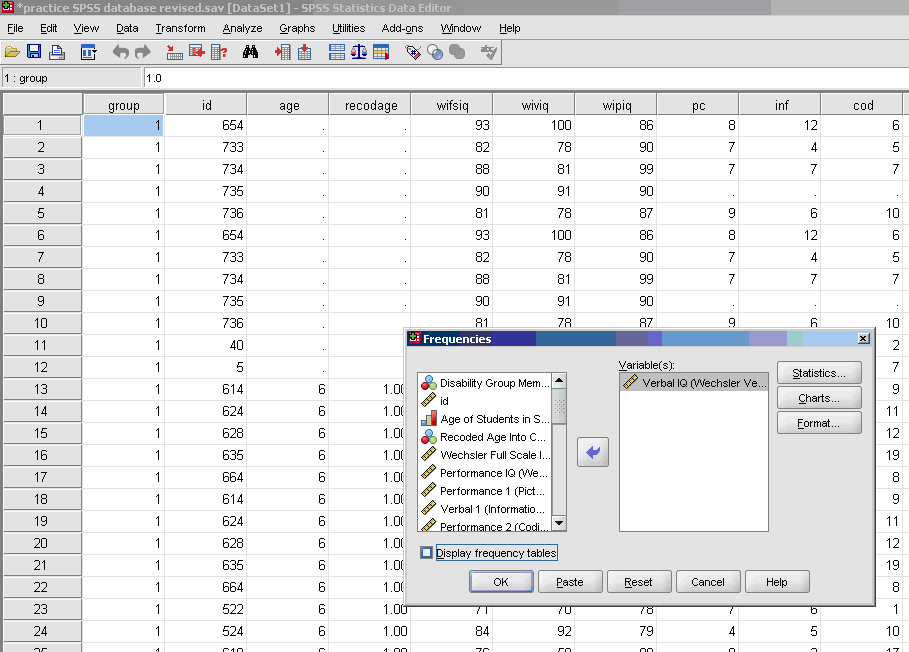
- * Uncheck the display frequency tables so that you are not provided with the frequencies of your data every time descriptive statistics are obtained.
- * OK
-
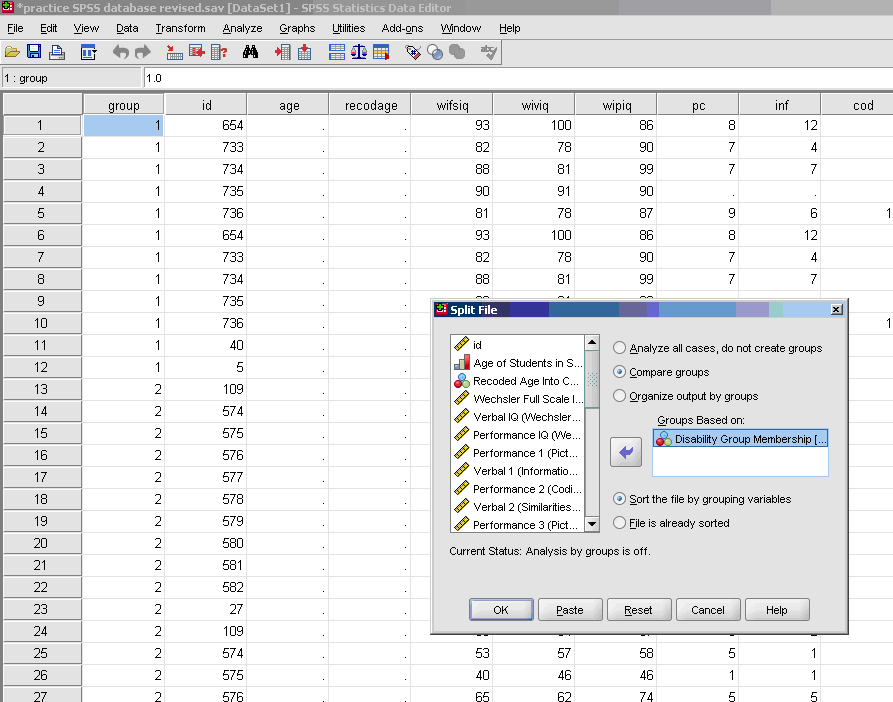
To obtain descriptive statistics for subgroups, do the following:
- * Split File (icon middle top of screen next to the scales)
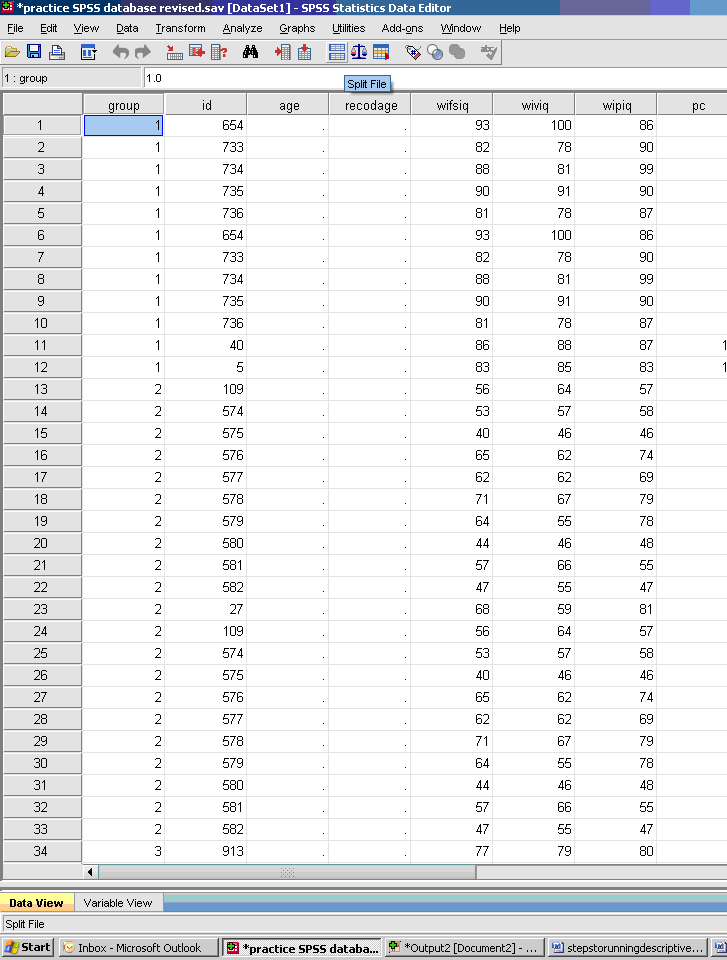
- * Compare Groups
- * Click on group (typically dichotomous in nature) and move to empty cell.
- √ Analyze
- * Descriptive Statistics
- * Frequencies
- * Move over the dependent variable/s
- * Do
NOT move over the independent variable/s or any string variables
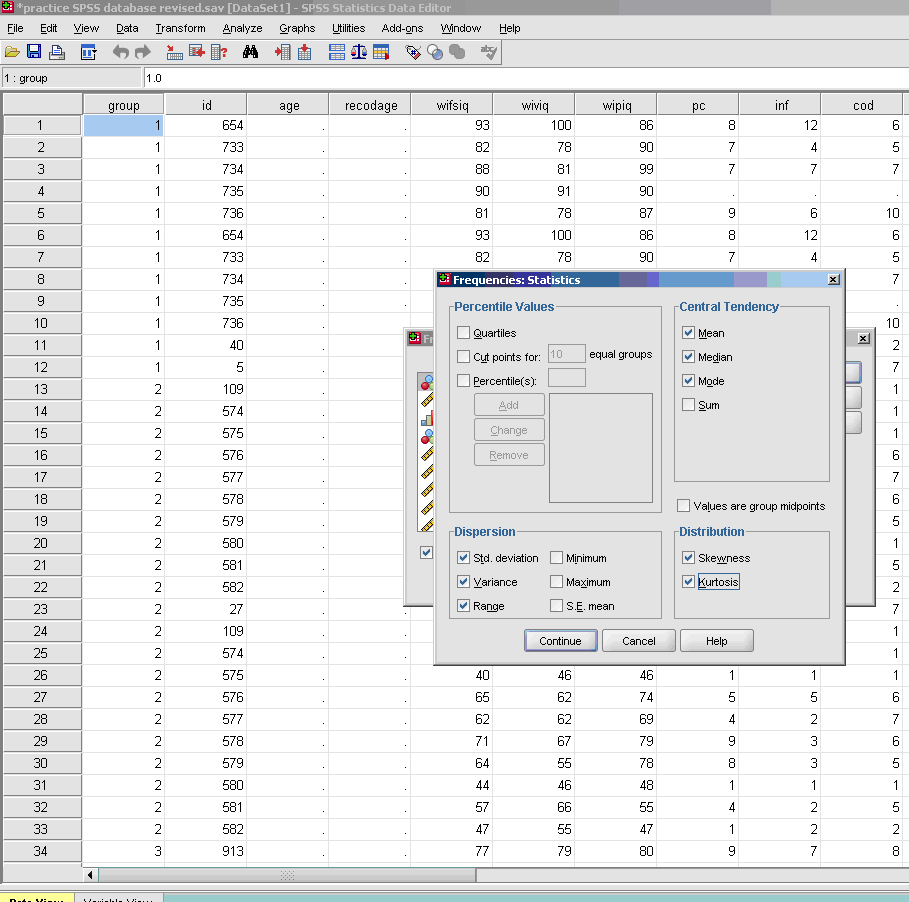
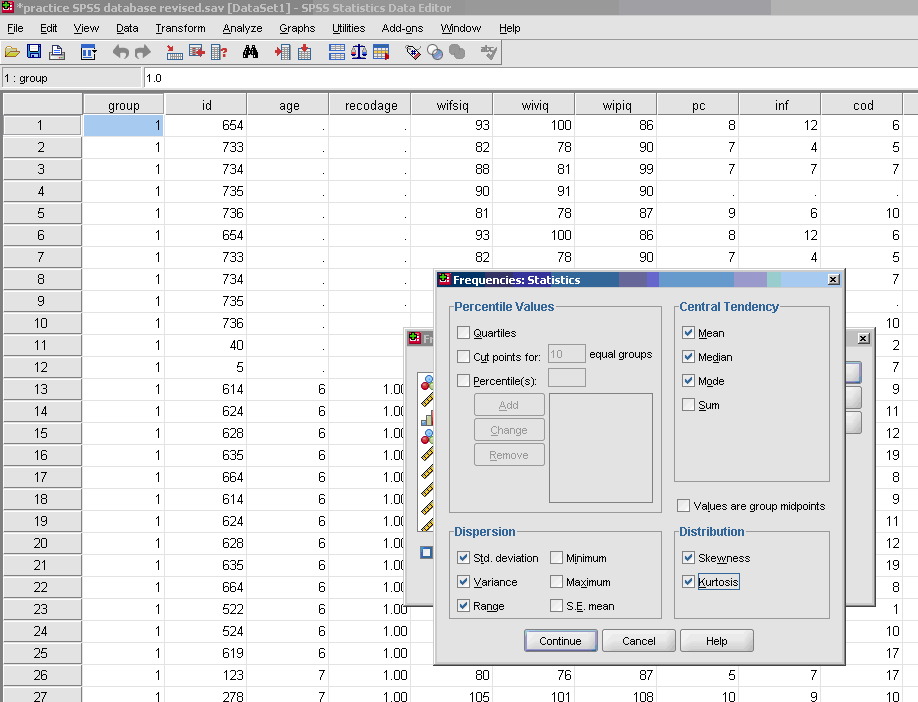
- √ Statistics
- * Three basic measures of central tendency, upper right part of screen: mean, median, and mode.
- * Three basic measures of variability, bottom left part of screen: variance, Standard Deviation, and range.
- * Skewness [Note. Skewness refers to the extent to which the data are normally distributed around the mean. Skewed data involve having either mostly high scores with a few low ones or having mostly low scores with a few high ones.] Readers are referred to the following sources for a more detailed definition of skewness:
(External Link)&term_id=356 and
(External Link)
- * Kurtosis [Note. Kurtosis also refers to the extent to which the data are normally distributed around the mean. This time, the data are piled up higher than normal around the mean or piled up higher than normal at the ends of the distribution.] Readers are referred to the following sources for a more detailed definition of kurtosis:
(External Link)&term_id=326 and
(External Link)
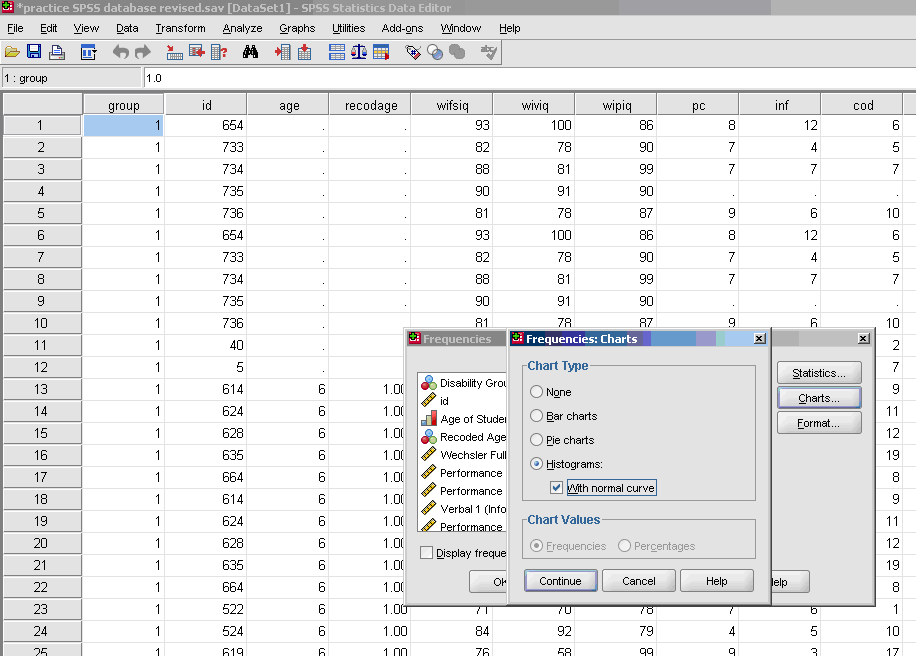
- * Charts (optional, use only if you want a visual depiction of your data)
- * Histograms (optional, use only if you want a visual depiction of your data)with normal curve
-
To calculate a
z
-score for any continuous variable:
- √ Analyze
- * Descriptive Statistics
- * Descriptives
- * Send variable on which you want
z -scores to be calculated to empty cell
- * Check box for Save standardized values as variables
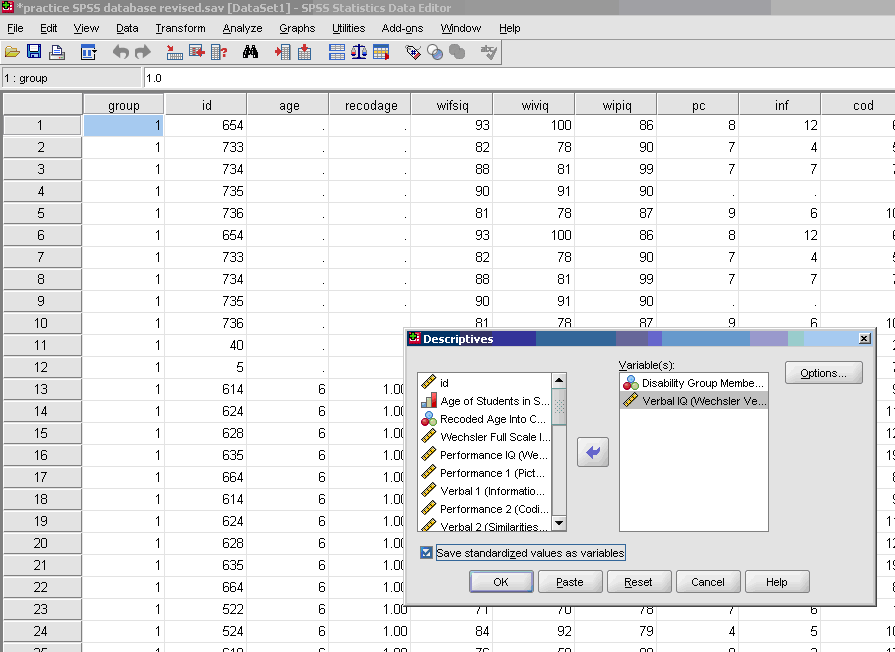
- * OK
- * You will be sent to the output window, as shown in Table 1. [Note. In some versions of SPSS, you will not be sent to the output window, but will remain in the data window.] The information in the output window is not relevant for your purposes. To see the variable that was just created, go to the SPSS data. The far right column should now be the new
z -score variable that was created.
| Descriptive Statistics |
|
N |
Minimum |
Maximum |
Mean |
Std. Deviation |
| Verbal IQ (Wechsler Verbal Intelligence 3) |
1182 |
46 |
129 |
77.97 |
13.661 |
| Valid N (listwise) |
1182 |
|
|
|
|
Descriptive Statistics
- * A new variable/s will have been generated for you in the data window
-
To get this information in a usable output form, do the following:
- √ Analyze
- * Descriptive Statistics
- * Frequencies
- * Move over the newly created
z -score variable(s) (
z -scores will generally appear at the bottom of your list with the words: “Zscore: Verbal IQ (Wechsler Verbal Intelligence 3)
- * Make sure the frequencies box is checked
- * OK
Source:
OpenStax, Calculating basic statistical procedures in spss: a self-help and practical guide to preparing theses, dissertations, and manuscripts. OpenStax CNX. Apr 28, 2011 Download for free at http://cnx.org/content/col11292/1.6
Google Play and the Google Play logo are trademarks of Google Inc.
