| << Chapter < Page | Chapter >> Page > |
By the end of this section, you will be able to:
Information on the consumption choices of Americans is available from the Consumer Expenditure Survey carried out by the U.S. Bureau of Labor Statistics. [link] shows spending patterns for the average U.S. household. The first row shows income and, after taxes and personal savings are subtracted, it shows that, in 2015, the average U.S. household spent $48,109 on consumption. The table then breaks down consumption into various categories. The average U.S. household spent roughly one-third of its consumption on shelter and other housing expenses, another one-third on food and vehicle expenses, and the rest on a variety of items, as shown. Of course, these patterns will vary for specific households by differing levels of family income, by geography, and by preferences.
| Average Household Income before Taxes | $62,481 |
| Average Annual Expenditures | $48.109 |
| Food at home | $3,264 |
| Food away from home | $2,505 |
| Housing | $16,557 |
| Apparel and services | $1,700 |
| Transportation | $7,677 |
| Healthcare | $3,157 |
| Entertainment | $2,504 |
| Education | $1,074 |
| Personal insurance and pensions | $5,357 |
| All else: alcohol, tobacco, reading, personal care, cash contributions, miscellaneous | $3,356 |
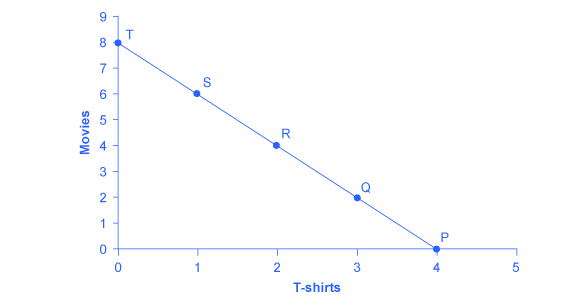
To understand how a household will make its choices, economists look at what consumers can afford, as shown in a budget constraint line , and the total utility or satisfaction derived from those choices. In a budget constraint line, the quantity of one good is measured on the horizontal axis and the quantity of the other good is measured on the vertical axis. The budget constraint line shows the various combinations of two goods that are affordable given consumer income. Consider the situation of José, shown in [link] . José likes to collect T-shirts and watch movies.
In [link] , the quantity of T-shirts is shown on the horizontal axis, while the quantity of movies is shown on the vertical axis. If José had unlimited income or goods were free, then he could consume without limit. But José, like all of us, faces a budget constraint . José has a total of $56 to spend. The price of T-shirts is $14 and the price of movies is $7. Notice that the vertical intercept of the budget constraint line is at eight movies and zero T-shirts ($56/$7=8). The horizontal intercept of the budget constraint is four, where José spends of all of his money on T-shirts and no movies ($56/14=4). The slope of the budget constraint line is rise/run or –8/4=–2. The specific choices along the budget constraint line show the combinations of T-shirts and movies that are affordable.

José wishes to choose the combination that will provide him with the greatest utility , which is the term economists use to describe a person’s level of satisfaction or happiness with his or her choices.

Notification Switch
Would you like to follow the 'Microeconomics' conversation and receive update notifications?