| << Chapter < Page | Chapter >> Page > |
By the end of this section, you will be able to:
Macroeconomics is an empirical subject, so the first step toward understanding it is to measure the economy.
How large is the U.S. economy? The size of a nation’s overall economy is typically measured by its gross domestic product (GDP) , which is the value of all final goods and services produced within a country in a given year. The measurement of GDP involves counting up the production of millions of different goods and services—smart phones, cars, music downloads, computers, steel, bananas, college educations, and all other new goods and services produced in the current year—and summing them into a total dollar value. This task is straightforward: take the quantity of everything produced, multiply it by the price at which each product sold, and add up the total. In 2014, the U.S. GDP totaled $17.4 trillion, the largest GDP in the world.
Each of the market transactions that enter into GDP must involve both a buyer and a seller. The GDP of an economy can be measured either by the total dollar value of what is purchased in the economy, or by the total dollar value of what is produced. There is even a third way, as we will explain later.
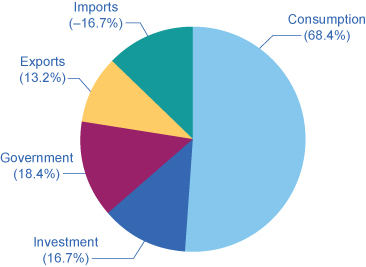
Who buys all of this production? This demand can be divided into four main parts: consumer spending (consumption), business spending (investment), government spending on goods and services, and spending on net exports. (See the following Clear It Up feature to understand what is meant by investment.) [link] shows how these four components added up to the GDP in 2014. [link] (a) shows the levels of consumption, investment, and government purchases over time, expressed as a percentage of GDP, while [link] (b) shows the levels of exports and imports as a percentage of GDP over time. A few patterns about each of these components are worth noticing. [link] shows the components of GDP from the demand side. [link] provides a visual of the percentages.
| Components of GDP on the Demand Side (in trillions of dollars) | Percentage of Total | |
|---|---|---|
| Consumption | $11.9 | 68.4% |
| Investment | $2.9 | 16.7% |
| Government | $3.2 | 18.4% |
| Exports | $2.3 | 13.2% |
| Imports | –$2.9 | –16.7% |
| Total GDP | $17.4 | 100% |

What do economists mean by investment, or business spending? In calculating GDP, investment does not refer to the purchase of stocks and bonds or the trading of financial assets. It refers to the purchase of new capital goods, that is, new commercial real estate (such as buildings, factories, and stores) and equipment, residential housing construction, and inventories. Inventories that are produced this year are included in this year’s GDP—even if they have not yet sold. From the accountant’s perspective, it is as if the firm invested in its own inventories. Business investment in 2014 was almost $3 trillion, according to the Bureau of Economic Analysis.

Notification Switch
Would you like to follow the 'Macroeconomics' conversation and receive update notifications?