| << Chapter < Page | Chapter >> Page > |
| Price | Brazil: Quantity Supplied (tons) | Brazil: Quantity Demanded (tons) | U.S.: Quantity Supplied (tons) | U.S.: Quantity Demanded (tons) |
|---|---|---|---|---|
| 8 cents | 20 | 35 | 60 | 100 |
| 12 cents | 30 | 30 | 66 | 93 |
| 14 cents | 35 | 28 | 69 | 90 |
| 16 cents | 40 | 25 | 72 | 87 |
| 20 cents | 45 | 21 | 76 | 83 |
| 24 cents | 50 | 18 | 80 | 80 |
| 28 cents | 55 | 15 | 82 | 78 |
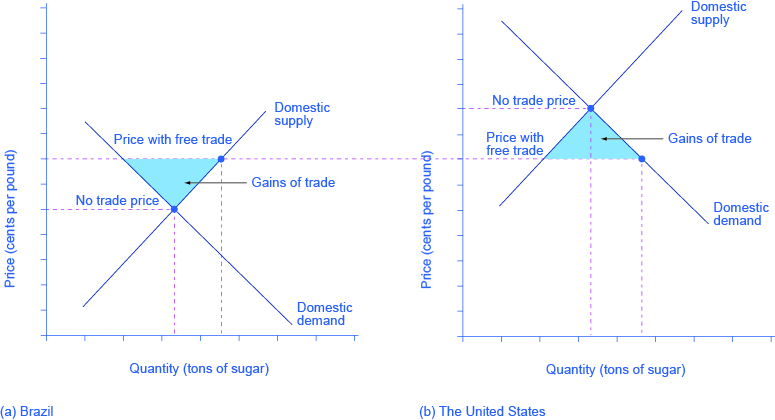
If international trade between Brazil and the United States now becomes possible, profit-seeking firms will spot an opportunity: buy sugar cheaply in Brazil, and sell it at a higher price in the United States. As sugar is shipped from Brazil to the United States, the quantity of sugar produced in Brazil will be greater than Brazilian consumption (with the extra production being exported), and the amount produced in the United States will be less than the amount of U.S. consumption (with the extra consumption being imported). Exports to the United States will reduce the supply of sugar in Brazil, raising its price. Imports into the United States will increase the supply of sugar, lowering its price. When the price of sugar is the same in both countries, there is no incentive to trade further. As [link] shows, the equilibrium with trade occurs at a price of 16 cents per pound. At that price, the sugar farmers of Brazil supply a quantity of 40 tons, while the consumers of Brazil buy only 25 tons.
The extra 15 tons of sugar production, shown by the horizontal gap between the demand curve and the supply curve in Brazil, is exported to the United States. In the United States, at a price of 16 cents, the farmers produce a quantity of 72 tons and consumers demand a quantity of 87 tons. The excess demand of 15 tons by American consumers, shown by the horizontal gap between demand and domestic supply at the price of 16 cents, is supplied by imported sugar. Free trade typically results in income distribution effects, but the key is to recognize the overall gains from trade, as shown in [link] . Building on the concepts outlined in Demand and Supply and Demand, Supply, and Efficiency in terms of consumer and producer surplus, [link] (a) shows that producers in Brazil gain by selling more sugar at a higher price, while [link] (b) shows consumers in the United States benefit from the lower price and greater availability of sugar. Consumers in Brazil are worse off (compare their no-trade consumer surplus with the free-trade consumer surplus) and U.S. producers of sugar are worse off. There are gains from trade—an increase in social surplus in each country. That is, both the United States and Brazil are better off than they would be without trade. The following Clear It Up feature explains how trade policy can influence low-income countries.

Visit this website to read more about the global sugar trade.
Why are the poor countries of the world poor? There are a number of reasons, but one of them will surprise you: the trade policies of the high-income countries. Following is a stark review of social priorities which has been widely publicized by the international aid organization, Oxfam International .
High-income countries of the world—primarily the United States, Canada, countries of the European Union, and Japan—subsidize their domestic farmers collectively by about $360 billion per year. By contrast, the total amount of foreign aid from these same high-income countries to the poor countries of the world is about $70 billion per year, or less than 20% of the farm subsidies. Why does this matter?
It matters because the support of farmers in high-income countries is devastating to the livelihoods of farmers in low-income countries . Even when their climate and land are well-suited to products like cotton, rice, sugar, or milk, farmers in low-income countries find it difficult to compete. Farm subsidies in the high-income countries cause farmers in those countries to increase the amount they produce. This increase in supply drives down world prices of farm products below the costs of production. As Michael Gerson of the Washington Post describes it: “[T]he effects in the cotton-growing regions of West Africa are dramatic . . . keep[ing]millions of Africans on the edge of malnutrition. In some of the poorest countries on Earth, cotton farmers are some of the poorest people, earning about a dollar a day. . . . Who benefits from the current system of subsidies? About 20,000 American cotton producers, with an average annual income of more than $125,000.”
As if subsidies were not enough, often, the high-income countries block agricultural exports from low-income countries. In some cases, the situation gets even worse when the governments of high-income countries, having bought and paid for an excess supply of farm products, give away those products in poor countries and drive local farmers out of business altogether.
For example, shipments of excess milk from the European Union to Jamaica have caused great hardship for Jamaican dairy farmers. Shipments of excess rice from the United States to Haiti drove thousands of low-income rice farmers in Haiti out of business. The opportunity costs of protectionism are not paid just by domestic consumers, but also by foreign producers—and for many agricultural products, those foreign producers are the world’s poor.

Notification Switch
Would you like to follow the 'Macroeconomics' conversation and receive update notifications?