| << Chapter < Page | Chapter >> Page > |
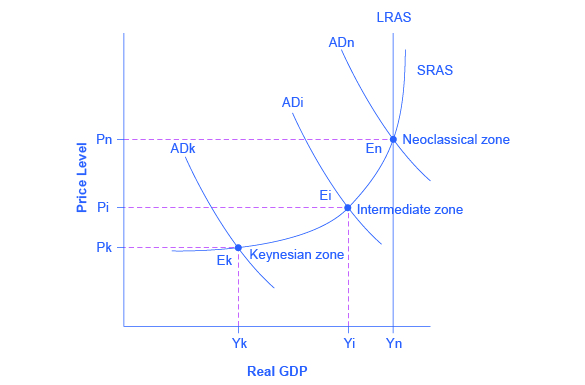
The AD/AS model can be used to illustrate both Say’s law that supply creates its own demand and Keynes’ law that demand creates its own supply. Consider the three zones of the SRAS curve as identified in [link] : the Keynesian zone, the neoclassical zone, and the intermediate zone.

Focus first on the Keynesian zone , that portion of the SRAS curve on the far left which is relatively flat. If the AD curve crosses this portion of the SRAS curve at an equilibrium point like Ek, then certain statements about the economic situation will follow. In the Keynesian zone, the equilibrium level of real GDP is far below potential GDP, the economy is in recession, and cyclical unemployment is high. If aggregate demand shifted to the right or left in the Keynesian zone, it will determine the resulting level of output (and thus unemployment). However, inflationary price pressure is not much of a worry in the Keynesian zone, since the price level does not vary much in this zone.
Now, focus your attention on the neoclassical zone of the SRAS curve, which is the near-vertical portion on the right-hand side. If the AD curve crosses this portion of the SRAS curve at an equilibrium point like En where output is at or near potential GDP, then the size of potential GDP pretty much determines the level of output in the economy. Since the equilibrium is near potential GDP, cyclical unemployment is low in this economy, although structural unemployment may remain an issue. In the neoclassical zone, shifts of aggregate demand to the right or the left have little effect on the level of output or employment. The only way to increase the size of the real GDP in the neoclassical zone is for AS to shift to the right. However, shifts in AD in the neoclassical zone will create pressures to change the price level.

Notification Switch
Would you like to follow the 'Macroeconomics' conversation and receive update notifications?