| << Chapter < Page | Chapter >> Page > |
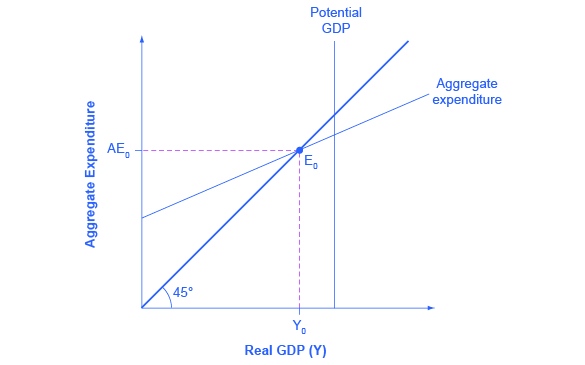
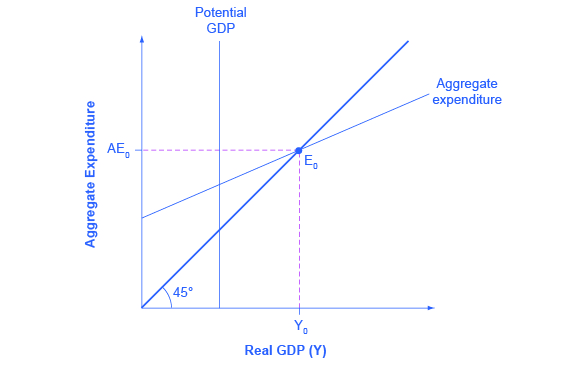
In a Keynesian cross diagram, the equilibrium may be at a level below potential GDP, which is called a recessionary gap, or at a level above potential GDP, which is called an inflationary gap.
The multiplier effect describes how an initial change in aggregate demand generated several times as much as cumulative GDP. The size of the spending multiplier is determined by three leakages: spending on savings, taxes, and imports. The formula for the multiplier is:
An economy with a lower multiplier is more stable—it is less affected either by economic events or by government policy than an economy with a higher multiplier.
Sketch the aggregate expenditure-output diagram with the recessionary gap.

Sketch the aggregate expenditure-output diagram with an inflationary gap.

An economy has the following characteristics:
Y = National income
Taxes = T = 0.25Y
C = Consumption = 400 + 0.85(Y – T)
I = 300
G = 200
X = 500
M = 0.1(Y – T)
Find the equilibrium for this economy. If potential GDP is 3,500, then what change in government spending is needed to achieve this level? Do this problem two ways. First, plug 3,500 into the equations and solve for G. Second, calculate the multiplier and figure it out that way.
Then insert Y for AE and 0.25Y for T.
If full employment is 3,500, then one approach is to plug in 3,500 for Y throughout the equation, but to leave G as a separate variable.
A G value of 331.25 is an increase of 131.25 from its original level of 200.
Alternatively, the multiplier is that, out of every dollar spent, 0.25 goes to taxes, leaving 0.75, and out of after-tax income, 0.15 goes to savings and 0.1 to imports. Because (0.75)(0.15) = 0.1125 and (0.75)(0.1) = 0.075, this means that out of every dollar spent: 1 –0.25 –0.1125 –0.075 = 0.5625.
Thus, using the formula, the multiplier is:
To increase equilibrium GDP by 300, it will take a boost of 300/2.2837, which again works out to 131.25.
[link] represents the data behind a Keynesian cross diagram. Assume that the tax rate is 0.4 of national income; the MPC out of the after-tax income is 0.8; investment is $2,000; government spending is $1,000; exports are $2,000 and imports are 0.05 of after-tax income. What is the equilibrium level of output for this economy?
| National Income | After-tax Income | Consumption | I + G + X | Minus Imports | Aggregate Expenditures |
|---|---|---|---|---|---|
| $8,000 | $4,340 | ||||
| $9,000 | |||||
| $10,000 | |||||
| $11,000 | |||||
| $12,000 | |||||
| $13,000 |

Notification Switch
Would you like to follow the 'Macroeconomics' conversation and receive update notifications?