| << Chapter < Page | Chapter >> Page > |
Notice that the “ d ” associated with the first term refers to the derivative (as the term is used in calculus) and is different from the death rate, also called “ d .” The difference between birth and death rates is further simplified by substituting the term “ r ” (intrinsic rate of increase) for the relationship between birth and death rates:
The value “ r” can be positive, meaning the population is increasing in size; or negative, meaning the population is decreasing in size; or zero, where the population’s size is unchanging, a condition known as zero population growth . A further refinement of the formula recognizes that different species have inherent differences in their intrinsic rate of increase (often thought of as the potential for reproduction), even under ideal conditions. Obviously, a bacterium can reproduce more rapidly and have a higher intrinsic rate of growth than a human. The maximal growth rate for a species is its biotic potential, or r max , thus changing the equation to:

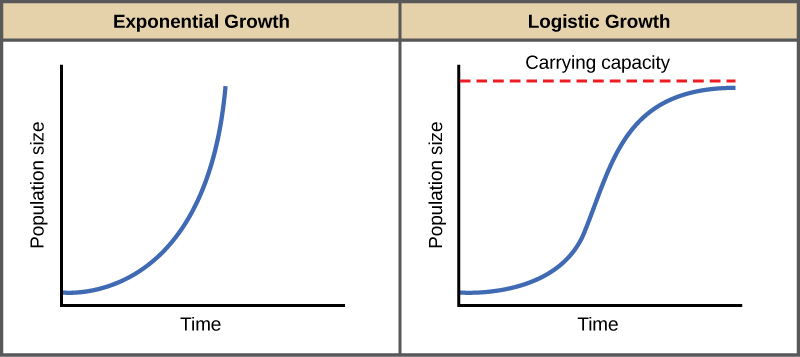
Exponential growth is possible only when infinite natural resources are available; this is not the case in the real world. Charles Darwin recognized this fact in his description of the “struggle for existence,” which states that individuals will compete (with members of their own or other species) for limited resources. The successful ones will survive to pass on their own characteristics and traits (which we know now are transferred by genes) to the next generation at a greater rate (natural selection). To model the reality of limited resources, population ecologists developed the logistic growth model.
In the real world, with its limited resources, exponential growth cannot continue indefinitely. Exponential growth may occur in environments where there are few individuals and plentiful resources, but when the number of individuals gets large enough, resources will be depleted, slowing the growth rate. Eventually, the growth rate will plateau or level off ( [link] ). This population size, which represents the maximum population size that a particular environment can support, is called the carrying capacity, or K .
The formula we use to calculate logistic growth adds the carrying capacity as a moderating force in the growth rate. The expression “ K – N ” is indicative of how many individuals may be added to a population at a given stage, and “ K – N ” divided by “ K ” is the fraction of the carrying capacity available for further growth. Thus, the exponential growth model is restricted by this factor to generate the logistic growth equation:

Notification Switch
Would you like to follow the 'University of georgia concepts of biology' conversation and receive update notifications?