| << Chapter < Page | Chapter >> Page > |

Not all cells adhere to the classic cell cycle pattern in which a newly formed daughter cell immediately enters the preparatory phases of interphase, closely followed by the mitotic phase. Cells in G 0 phase are not actively preparing to divide. The cell is in a quiescent (inactive) stage that occurs when cells exit the cell cycle. Some cells enter G 0 temporarily until an external signal triggers the onset of G 1 . Other cells that never or rarely divide, such as mature cardiac muscle and nerve cells, remain in G 0 permanently.
Problem : How long does a cell spend in interphase compared to each stage of mitosis?
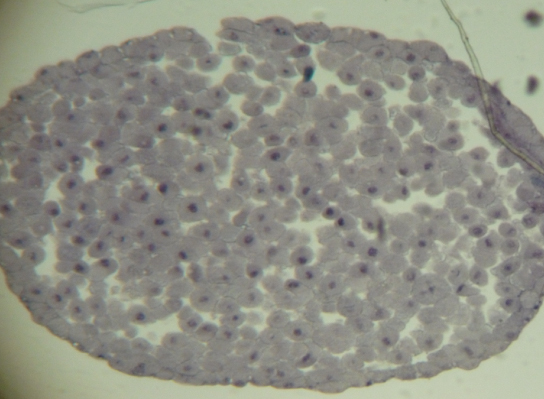
Background : A prepared microscope slide of blastula cross-sections will show cells arrested in various stages of the cell cycle. It is not visually possible to separate the stages of interphase from each other, but the mitotic stages are readily identifiable. If 100 cells are examined, the number of cells in each identifiable cell cycle stage will give an estimate of the time it takes for the cell to complete that stage.
Problem Statement : Given the events included in all of interphase and those that take place in each stage of mitosis, estimate the length of each stage based on a 24-hour cell cycle. Before proceeding, state your hypothesis.
Test your hypothesis : Test your hypothesis by doing the following:
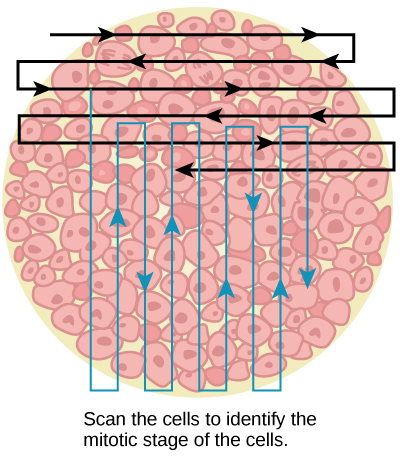
Switch to the high-power objective and slowly move the slide left to right, and up and down to view all the cells in the section ( [link] ). As you scan, you will notice that most of the cells are not undergoing mitosis but are in the interphase period of the cell cycle.


Record your observations : Make a table similar to [link] in which you record your observations.
| Results of Cell Stage Identification | |||
|---|---|---|---|
| Phase or Stage | Individual Totals | Group Totals | Percent |
| Interphase | |||
| Prophase | |||
| Metaphase | |||
| Anaphase | |||
| Telophase | |||
| Cytokinesis | |||
| Totals | 100 | 100 | 100 percent |
Analyze your data/report your results : To find the length of time whitefish blastula cells spend in each stage, multiply the percent (recorded as a decimal) by 24 hours. Make a table similar to [link] to illustrate your data.
| Estimate of Cell Stage Length | ||
|---|---|---|
| Phase or Stage | Percent (as Decimal) | Time in Hours |
| Interphase | ||
| Prophase | ||
| Metaphase | ||
| Anaphase | ||
| Telophase | ||
| Cytokinesis |
Draw a conclusion : Did your results support your estimated times? Were any of the outcomes unexpected? If so, discuss which events in that stage might contribute to the calculated time.
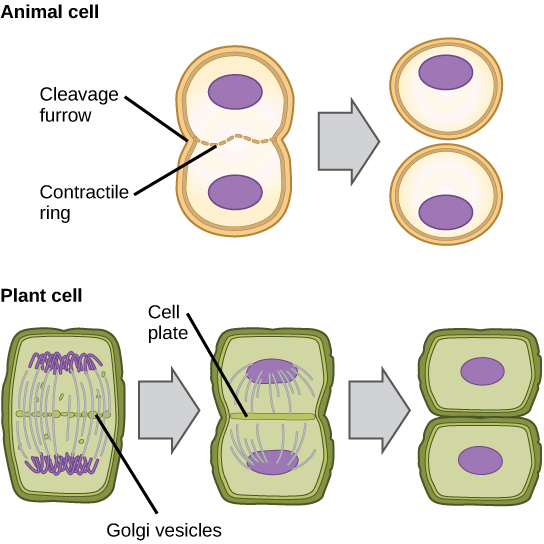
The cell cycle is an orderly sequence of events. Cells on the path to cell division proceed through a series of precisely timed and carefully regulated stages. In eukaryotes, the cell cycle consists of a long preparatory period, called interphase. Interphase is divided into G 1 , S, and G 2 phases. The mitotic phase begins with karyokinesis (mitosis), which consists of five stages: prophase, prometaphase, metaphase, anaphase, and telophase. The final stage of the mitotic phase is cytokinesis, during which the cytoplasmic components of the daughter cells are separated either by an actin ring (animal cells) or by cell plate formation (plant cells).

Notification Switch
Would you like to follow the 'Cellular reproduction' conversation and receive update notifications?