<< Chapter < Page Chapter >> Page >

Effects of change in budget surplus or deficit on investment, savings, and the trade balance

Following from the national savings and investment identity, charts (a) and (b) show what happens to investment, private savings, and the trade deficit when the budget deficit rises (or the budget surplus falls). (a) If the budget deficit rises (or the government budget surplus falls), the results could be (1) domestic private investment falls or (2) private savings rise or (3) the trade deficit increases (or a trade surplus diminishes). The opposite results of each are achieved when the budget deficit falls (or the budget surplus rises) as shown in image (b).
Chart (a) shows the potential results when the budget deficit rises (or budget surplus falls). Chart (b) shows the potential results when the budget deficit falls (or budget surplus rises).

What about budget surpluses and trade surpluses?

The national saving and investment identity must always hold true because, by definition, the quantity supplied and quantity demanded in the financial capital market must always be equal. However, the formula will look somewhat different if the government budget is in deficit rather than surplus or if the balance of trade is in surplus    rather than deficit . For example, in 1999 and 2000, the U.S. government had budget surpluses, although the economy was still experiencing trade deficits. When the government was running budget surpluses, it was acting as a saver rather than a borrower, and supplying rather than demanding financial capital. As a result, the national saving and investment identity during this time would be more properly written:

Quantity supplied of financial capital = Quantity demanded of financial capital Private savings + Trade deficit + Government surplus = Private investment S + (M – X) + (T – G) = I

Let's call this equation 3. Notice that this expression is mathematically the same as equation 2 except the savings and investment sides of the identity have simply flipped sides.

During the 1960s, the U.S. government was often running a budget deficit, but the economy was typically running trade surpluses. Since a trade surplus means that an economy is experiencing a net outflow of financial capital, the national saving and investment identity would be written:

Quantity supplied of financial capital = Quantity demanded of financial capital Private savings = Private investment + Outflow of foreign savings + Government budget deficit S = I + (X – M) + (G – T)

Instead of the balance of trade representing part of the supply of financial capital, which occurs with a trade deficit, a trade surplus represents an outflow of financial capital leaving the domestic economy and being invested elsewhere in the world.

Quantity supplied of financial capital = Quantity demanded of financial capital demand Private savings = Private investment + Government budget deficit + Trade surplus S = I + (G – T) + (X – M) 

The point to this parade of equations is that the national saving and investment identity is assumed to always hold. So when you write these relationships, it is important to engage your brain and think about what is on the supply side and what is on the demand side of the financial capital market before you put pencil to paper.

As can be seen in [link] , the Office of Management and Budget shows that the United States has consistently run budget deficits since 1977, with the exception of 1999 and 2000. What is alarming is the dramatic increase in budget deficits that has occurred since 2008, which in part reflects declining tax revenues and increased safety net expenditures due to the Great Recession. (Recall that T is net taxes. When the government must transfer funds back to individuals for safety net expenditures like Social Security and unemployment benefits, budget deficits rise.) These deficits have implications for the future health of the U.S. economy.
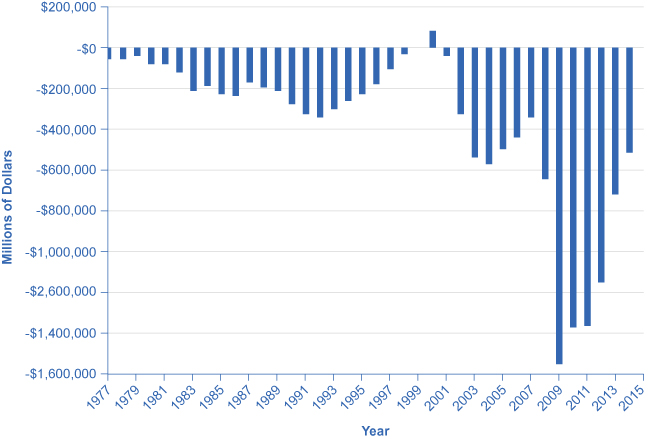
United states on-budget, surplus, and deficit, 1977–2014 ($ millions)

The graph shows U.S. government budgets and surpluses from 1977 to 2014. The United States has only had two years without a government budget deficit. In the 1980s the deficit hovered above –$200 million, gradually becoming a surplus by the end of 1990s. From 2000 onward, the deficit grew rapidly to –$600 million. The deficit was at its worst in 2009, at close to $1.6 trillion, following the Great Recession. In 2014, it was around –$514 million.
The United States has run a budget deficit for over 30 years, with the exception of 1999 and 2000. Military expenditures, entitlement programs, and the decrease in tax revenue coupled with increased safety net support during the Great Recession are major contributors to the dramatic increases in the deficit after 2008. (Source: Table 1.1, "Summary of Receipts, Outlays, and Surpluses or Deficits," https://www.whitehouse.gov/omb/budget/Historicals)

A rising budget deficit may result in a fall in domestic investment, a rise in private savings, or a rise in the trade deficit. The following modules discuss each of these possible effects in more detail.

Key concepts and summary

A change in any part of the national saving and investment identity suggests that if the government budget deficit changes, then either private savings, private investment in physical capital, or the trade balance—or some combination of the three—must change as well.

Questions & Answers

profit maximize for monopolistically?
Usman Reply
what kind of demand curve under monopoly?
Mik Reply
what is the difference between inflation and scarcity ?
Abdu Reply
What stops oligopolists from acting together as a monopolist and earning the highest possible level of profits?
Mik
why economics is difficult for 2nd school students.
Siraj Reply
what does mean opportunity cost?
Aster Reply
what is poetive effect of population growth
Solomon Reply
what is inflation
Nasir Reply
what is demand
Eleni
what is economics
IMLAN Reply
economics theory describes individual behavior as the result of a process of optimization under constraints the objective to be reached being determined by
Kalkidan
Economics is a branch of social science that deal with How to wise use of resource ,s
Kassie
need
WARKISA
Economic Needs: In economics, needs are goods or services that are necessary for maintaining a certain standard of living. This includes things like healthcare, education, and transportation.
Kalkidan
What is demand and supply
EMPEROR Reply
deman means?
Alex
what is supply?
Alex
ex play supply?
Alex
Money market is a branch or segment of financial market where short-term debt instruments are traded upon. The instruments in this market includes Treasury bills, Bonds, Commercial Papers, Call money among other.
murana Reply
good
Kayode
what is money market
umar Reply
Examine the distinction between theory of comparative cost Advantage and theory of factor proportion
Fatima Reply
What is inflation
Bright Reply
a general and ongoing rise in the level of prices in an economy
AI-Robot
What are the factors that affect demand for a commodity
Florence Reply
price
Kenu
differentiate between demand and supply giving examples
Lambiv Reply
differentiated between demand and supply using examples
Lambiv
what is labour ?
Lambiv

Get Jobilize Job Search Mobile App in your pocket Now!

Get it on Google Play Download on the App Store Now


Source:  OpenStax, Principles of economics. OpenStax CNX. Sep 19, 2014 Download for free at http://legacy.cnx.org/content/col11613/1.11
Google Play and the Google Play logo are trademarks of Google Inc.

Notification Switch

Would you like to follow the 'Principles of economics' conversation and receive update notifications?

Ask