| << Chapter < Page | Chapter >> Page > |
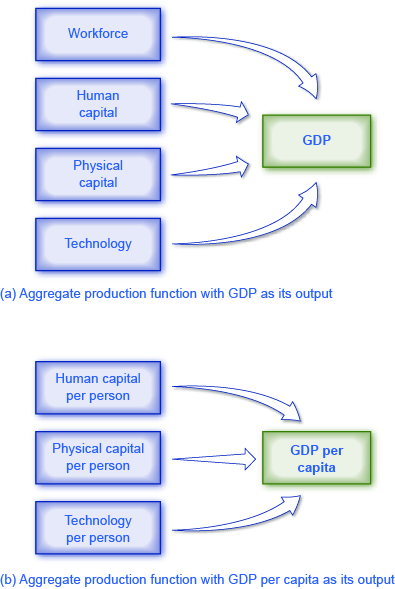
Economists construct different production functions depending on the focus of their studies. [link] presents two examples of aggregate production functions. In the first production function, shown in [link] (a), the output is GDP. The inputs in this example are workforce, human capital, physical capital, and technology. We discuss these inputs further in the module, Components of Economic Growth.

An economy’s rate of productivity growth is closely linked to the growth rate of its GDP per capita, although the two are not identical. For example, if the percentage of the population who holds jobs in an economy increases, GDP per capita will increase but the productivity of individual workers may not be affected. Over the long term, the only way that GDP per capita can grow continually is if the productivity of the average worker rises or if there are complementary increases in capital.
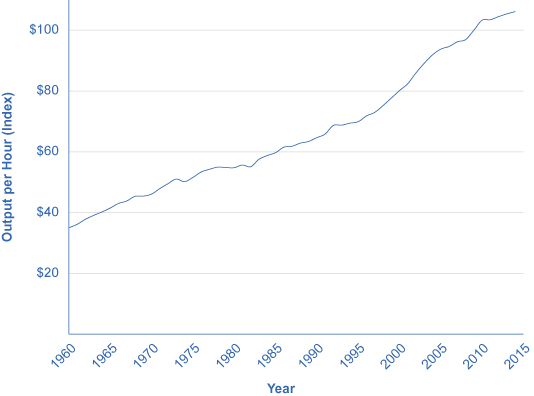
A common measure of U.S. productivity per worker is dollar value per hour the worker contributes to the employer’s output. This measure excludes government workers, because their output is not sold in the market and so their productivity is hard to measure. It also excludes farming, which accounts for only a relatively small share of the U.S. economy. [link] shows an index of output per hour, with 2009 as the base year (when the index equals 100). The index equaled about 106 in 2014. In 1972, the index equaled 50, which shows that workers have more than doubled their productivity since then.

According to the Department of Labor, U.S. productivity growth was fairly strong in the 1950s but then declined in the 1970s and 1980s before rising again in the second half of the 1990s and the first half of the 2000s. In fact, the rate of productivity measured by the change in output per hour worked averaged 3.2% per year from 1950 to 1970; dropped to 1.9% per year from 1970 to 1990; and then climbed back to over 2.3% from 1991 to the present, with another modest slowdown after 2001. [link] shows average annual rates of productivity growth averaged over time since 1950.

Notification Switch
Would you like to follow the 'Principles of economics' conversation and receive update notifications?