<< Chapter < Page Chapter >> Page >
By the end of this section, you will be able to:
  • Analyze GDP per capita as a measure of the diversity of international standards of living
  • Identify what classifies a country as low-income, middle-income, or high-income
  • Explain how standards of living are influenced by geography, demographics, industry structure, and economic institutions

The national economies that make up the global economy are remarkably diverse. Let us use one key indicator of the standard of living, GDP per capita    , to quantify this diversity. You will quickly see that quantifying this diversity is fraught with challenges and limitations. As explained in The Macroeconomic Perspective , we must consider using purchasing power parity or “international dollars” to convert average incomes into comparable units. Purchasing power parity, as formally defined in Exchange Rates and International Capital Flows , takes into account the fact that prices of the same good are different across countries.

The Macroeconomic Perspective explained how to measure GDP, the challenges of using GDP to compare standards of living, and the difficulty of confusing economic size with distribution. In China's case, for example, China ranks as the second largest global economy, second to only the United States, with Japan being third. But, when we take China's GDP of $9.2 trillion and divide it by its population of 1.4 billion, then the per capita GDP is only $6,900, which is significantly lower than that of Japan, at $38,500, and that of the United States, at $52,800. Measurement issues aside, it’s worth repeating that the goal, then, is to not only increase GDP, but to strive toward increased GDP per capita to increase overall standards of living for individuals. As we have learned from Economic Growth , this can be achieved at the national level by designing policies that increase worker productivity, deepen capital, and advance technology.

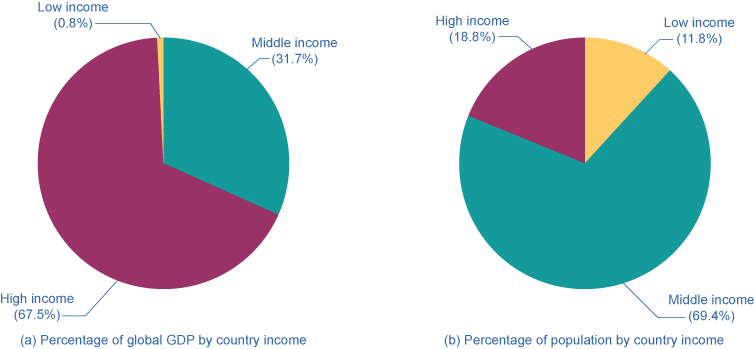
GDP per capita also allows us to rank countries into high-, middle-, or low-income groups. Low-income countries are those with $1,025 per capita GDP per year; middle-income countries have a per capita GDP between $1,025 and $12,475; while high-income countries have over $12,475 per year per capita income. As seen in [link] and [link] , high-income countries earn 68% of world income, but represent just 12% of the global population. Low-income countries earn 1% of total world income, but represent 18.5% of global population.

(Source:http://databank.worldbank.org/data/views/reports/tableview.aspx?isshared=true&ispopular=series&pid=20)
World income versus global population
Ranking based on GDP/capita GDP (in billions) % of Global GDP Population % of Global Population
Low income ($1,025 or less) $612.7 0.8% 848,700,000 11.8%
Middle income ($1,025 - $12,475) $23,930 31.7% 4,970,000,000 69.4%
High income (more than $12,475) $51,090,000,000 67.5% 1,306,000,000 18.8%
World Total income $75,592,941 7,162,119,434

Percent of global gdp and percent of population

The pie charts illustrate the inverse proportionality of global GDP by country to population.
The pie charts show the GDP (from 2011) for countries categorized into low, middle, or high income. Low-income are those earning less than $1,025 (less than 1% of global income). They represent 18.5% of the world population. Middle-income countries are those with per capita income of $1,025–$12,475 (31.1% of global income). They represent 69.5% of world population. High-income countries have 68.3% of global income and 12% of the world’s population. (Source: http://databank.worldbank.org/data/views/reports/tableview.aspx?isshared=true&ispopular=series&pid=20)

Questions & Answers

profit maximize for monopolistically?
Usman Reply
what kind of demand curve under monopoly?
Mik Reply
what is the difference between inflation and scarcity ?
Abdu Reply
What stops oligopolists from acting together as a monopolist and earning the highest possible level of profits?
Mik
why economics is difficult for 2nd school students.
Siraj Reply
what does mean opportunity cost?
Aster Reply
what is poetive effect of population growth
Solomon Reply
what is inflation
Nasir Reply
what is demand
Eleni
what is economics
IMLAN Reply
economics theory describes individual behavior as the result of a process of optimization under constraints the objective to be reached being determined by
Kalkidan
Economics is a branch of social science that deal with How to wise use of resource ,s
Kassie
need
WARKISA
Economic Needs: In economics, needs are goods or services that are necessary for maintaining a certain standard of living. This includes things like healthcare, education, and transportation.
Kalkidan
What is demand and supply
EMPEROR Reply
deman means?
Alex
what is supply?
Alex
ex play supply?
Alex
Money market is a branch or segment of financial market where short-term debt instruments are traded upon. The instruments in this market includes Treasury bills, Bonds, Commercial Papers, Call money among other.
murana Reply
good
Kayode
what is money market
umar Reply
Examine the distinction between theory of comparative cost Advantage and theory of factor proportion
Fatima Reply
What is inflation
Bright Reply
a general and ongoing rise in the level of prices in an economy
AI-Robot
What are the factors that affect demand for a commodity
Florence Reply
price
Kenu
differentiate between demand and supply giving examples
Lambiv Reply
differentiated between demand and supply using examples
Lambiv
what is labour ?
Lambiv

Get Jobilize Job Search Mobile App in your pocket Now!

Get it on Google Play Download on the App Store Now


Source:  OpenStax, Principles of economics. OpenStax CNX. Sep 19, 2014 Download for free at http://legacy.cnx.org/content/col11613/1.11
Google Play and the Google Play logo are trademarks of Google Inc.

Notification Switch

Would you like to follow the 'Principles of economics' conversation and receive update notifications?

Ask