<< Chapter < Page Chapter >> Page >

By the end of this section, you will be able to:

  • Evaluate the appropriate competition policy for a natural monopoly
  • Interpret a graph of regulatory choices
  • Contrast cost-plus and price cap regulation

Most true monopolies today in the U.S. are regulated, natural monopolies. A natural monopoly poses a difficult challenge for competition policy, because the structure of costs and demand seems to make competition unlikely or costly. A natural monopoly    arises when average costs are declining over the range of production that satisfies market demand. This typically happens when fixed costs are large relative to variable costs. As a result, one firm is able to supply the total quantity demanded in the market at lower cost than two or more firms—so splitting up the natural monopoly would raise the average cost of production and force customers to pay more.

Public utilities, the companies that have traditionally provided water and electrical service across much of the United States, are leading examples of natural monopoly. It would make little sense to argue that a local water company should be broken up into several competing companies, each with its own separate set of pipes and water supplies. Installing four or five identical sets of pipes under a city, one for each water company, so that each household could choose its own water provider, would be terribly costly. The same argument applies to the idea of having many competing companies for delivering electricity to homes, each with its own set of wires. Before the advent of wireless phones, the argument also applied to the idea of many different phone companies, each with its own set of phone wires running through the neighborhood.

The choices in regulating a natural monopoly

So what then is the appropriate competition policy for a natural monopoly? [link] illustrates the case of natural monopoly, with a market demand curve that cuts through the downward-sloping portion of the average cost curve . Points A, B, C, and F illustrate four of the main choices for regulation. [link] outlines the regulatory choices for dealing with a natural monopoly.
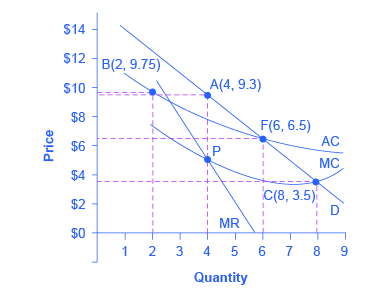
Regulatory choices in dealing with natural monopoly

The graph represents a natural monopoly. The graph shows four points that represent the main choices for regulation, a downward-sloping average cost curve, and a downward-sloping market demand curve.
A natural monopoly will maximize profits by producing at the quantity where marginal revenue (MR) equals marginal costs (MC) and by then looking to the market demand curve to see what price to charge for this quantity. This monopoly will produce at point A, with a quantity of 4 and a price of 9.3. If antitrust regulators split this company exactly in half, then each half would produce at point B, with average costs of 9.75 and output of 2. The regulators might require the firm to produce where marginal cost crosses the market demand curve at point C. However, if the firm is required to produce at a quantity of 8 and sell at a price of 3.5, the firm will suffer from losses. The most likely choice is point F, where the firm is required to produce a quantity of 6 and charge a price of 6.5.
(*Total Revenue is given by multiplying price and quantity. However, some of the price values in this table have been rounded for ease of presentation.)
Regulatory choices in dealing with natural monopoly
Quantity Price Total Revenue * Marginal Revenue Total Cost Marginal Cost Average Cost
1 14.7 14.7 - 11.0 - 11.00
2 12.4 24.7 10.0 19.5 8.5 9.75
3 10.6 31.7 7.0 25.5 6.0 8.50
4 9.3 37.2 5.5 31.0 5.5 7.75
5 8.0 40.0 2.8 35.0 4.0 7.00
6 6.5 39.0 –1.0 39.0 4.0 6.50
7 5.0 35.0 –4.0 42.0 3.0 6.00
8 3.5 28.0 –7.0 45.5 3.5 5.70
9 2.0 18.0 –10.0 49.5 4.0 5.5

Questions & Answers

profit maximize for monopolistically?
Usman Reply
what kind of demand curve under monopoly?
Mik Reply
what is the difference between inflation and scarcity ?
Abdu Reply
What stops oligopolists from acting together as a monopolist and earning the highest possible level of profits?
Mik
why economics is difficult for 2nd school students.
Siraj Reply
what does mean opportunity cost?
Aster Reply
what is poetive effect of population growth
Solomon Reply
what is inflation
Nasir Reply
what is demand
Eleni
what is economics
IMLAN Reply
economics theory describes individual behavior as the result of a process of optimization under constraints the objective to be reached being determined by
Kalkidan
Economics is a branch of social science that deal with How to wise use of resource ,s
Kassie
need
WARKISA
Economic Needs: In economics, needs are goods or services that are necessary for maintaining a certain standard of living. This includes things like healthcare, education, and transportation.
Kalkidan
What is demand and supply
EMPEROR Reply
deman means?
Alex
what is supply?
Alex
ex play supply?
Alex
Money market is a branch or segment of financial market where short-term debt instruments are traded upon. The instruments in this market includes Treasury bills, Bonds, Commercial Papers, Call money among other.
murana Reply
good
Kayode
what is money market
umar Reply
Examine the distinction between theory of comparative cost Advantage and theory of factor proportion
Fatima Reply
What is inflation
Bright Reply
a general and ongoing rise in the level of prices in an economy
AI-Robot
What are the factors that affect demand for a commodity
Florence Reply
price
Kenu
differentiate between demand and supply giving examples
Lambiv Reply
differentiated between demand and supply using examples
Lambiv
what is labour ?
Lambiv

Get Jobilize Job Search Mobile App in your pocket Now!

Get it on Google Play Download on the App Store Now


Source:  OpenStax, Principles of economics. OpenStax CNX. Sep 19, 2014 Download for free at http://legacy.cnx.org/content/col11613/1.11
Google Play and the Google Play logo are trademarks of Google Inc.

Notification Switch

Would you like to follow the 'Principles of economics' conversation and receive update notifications?

Ask